Earlier in the month I introduced you to The Danielcode with "The Danielcode...Beyond Da Vinci" which you can read in the FSO Archives. In that article I explained the origins of this ancient and mystic number sequence and made a giant statement:
"The answer appears to be that the Danielcode defines all markets in all timeframes".
"You can't say that" they cried. "What are you smoking" and "What about the Fibs" followed close behind and quite rightly. If my statement is true it provides a significant challenge for investors, hedgers and traders alike to consider so I must be able to adduce solid evidence to support my claim. To this end I intend to examine a series of quite different markets where we will use exactly the same Daniel number sequence and measurement techniques to test the universal application of this provocative statement.
The only universal language is numbers. Hold up your hand and count to five. If you contract to sell that many of anything, cars, camels or gold bars anywhere and in any language and you deliver one less there is going to be a problem! Raw numbers cannot lie. When they are collated, averaged, substituted, amortized, regressed or otherwise massaged the output will change usually to serve the purpose of he who is doing the massaging but the raw numbers properly counted; count one, two, three, four, five; never change. The proof of the veracity of the Danielcode is a light switch solution; on or off. It either is true or is not true. There is no middle ground. Raw numbers are the proof of the hypothesis.
This week I have selected GBP-JPY in response to requests from readers. This cross is a trader's favourite, but not one I have previously covered.
The Danielcode has been primarily a tool for long term investors and commercial hedging where long term trends are paramount, but it seems to be in the process of discovery by shorter term traders. The hypothesis specifically stipulates "all timeframes" so this enquiry is legitimate. The Daniel number sequence always starts from a significant high or low. On a quarterly chart there are few significant turns so few Daniel numbers created. As the bar periods reduce the number of significant turns increases exponentially as do the number of Daniel targets.
Investors and commercial hedgers need longer term charts and traders need shorter term charts. We will work from the long term chart to shorter time frames. An understanding of how the Danielcode charts are built at:
https://www.financialsensearchive.com/asia/danielcode/2008/0122.html will assist in following the sequence.
Here is GBP-JPY from 1977 to date on a quarterly bar chart, a thirty year period which should be a fair test.
The high in March 1980 contains the price matrix from which the Daniel sequence begins. We commence by creating the first three Daniel projections for the Quarterly chart. Remember that the Danielcode is an infinite sequence. In practice I place the first group of targets on the chart and look for price behavior at or very close to those levels to tell us that the market is recognising these market levels which are unknown to others.
Quarterly
GBP-JPY
We had only two targets relevant to this chart, the first at 225.13 which held the market for three and a half years (now you know why) and forced a nine month rally before making its closing low at 133.42, a variance against our Daniel number of 3.35 points over fifteen years.
Did you close out your hedge too soon? Of course you did.
Was this worth knowing?
As you view these charts, particularly as we go down the time frames, see if you can observe that the Daniel number sequence is more than just unique support and resistance; they also have directional properties. We can say with a high degree of probability that a reversal at a Daniel number means that the alternate trend will come into effect until new or previous numbers in the sequence are achieved. Hence we have a trend indicator as well as a target maker. What else do you need?
One of the quirks of the Danielcode is that it can complete its targets by either a high/low bar or on a close only basis. This is how.
Charles Dow always kept a "close only" chart and so should you.
Monthly
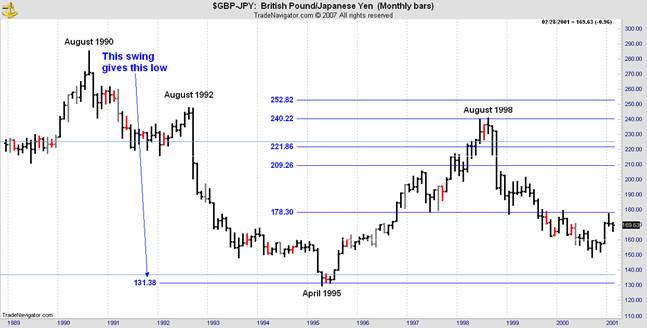
Having found our very long term low we switch down to the monthly time frame:
First we get the April 1995 low again from a different price matrix, this time embedded in the August 1990 high. The monthly chart places the target for low at 131.38; the quarterly chart calculated it at 136.77. Either is acceptable. The quarterly targets for low come from the 1980 top and the monthly target for low came from the 1990 top.So we have closely related Daniel numbers from price structures 10 years apart.
Let's think about this a little more. In my experience traders come in two sizes, "Action Man" and "Market Ascetic". Action Man grabs the tools at his disposal, usually the more the better, and gets right to it. He has the first trade of the day and probably the last. For every losing trade he seeks another indicator. He doesn't actually fathom that indicators are secondary and tertiary creations but indicators and systems become the Holy Grail. Though the Grail exists, he is destined never to see it.
Market Ascetics use few if any indicators, they are patient traders waiting for the high probability setup; they spend much time thinking; they seek to become Gnostics (from the Greek gnōstikos, concerning knowledge),they want to understand. As wise men they know that understanding itself is the Grail and profits follow knowledge. As you approach Gnosis, the indicators will slip away, you will be less frantic, perhaps even calm and relaxed; you will begin to analyse markets not just jump on the next stochastic squiggle with the usual results. Entering on the usual reversal signals but against the Daniel number will start you on the path to Gnosis.
How many of you have measured market ranges and explored the relationship between them? It is a frustrating task. There are just enough fib relationships to keep you putting those fibs on your charts but too few to pass the scientific proof of repeatability particularly on long term price ranges. What I am showing you in this series of articles is not just the precision but the repeatability of the Daniel number sequence.
Consider the quarterly and monthly charts above. The time bars are different and the ranges are different. The constant is the Danielcode ratios which produce varying linear range targets because the price structures that contain the price matrix at highs and lows are different. The matrix is the same but the internal price divisions are different. The only constant on the input side is the Danielcode ratios. On the output side we see markets consistently recognising the Daniel numbers in a temporary or terminal way but always in a repeatable way which they would not do if the numbers were random.
If we have only one constant to create the Daniel number sequence that markets "recognise", there must be a relationship, not in the linear price levels as is thought and for which charting packages provide tools, but in the remaining input, the price structures that create significant highs and lows. How markets composed of perhaps tens of thousands of investors, hedgers and traders across entirely different markets and across the globe consistently if unknowingly conspire to create the same price matrix in every market at every major turn is beyond my understanding. As, the Daniel numbers which define these highs and lows are known only to a handful of people there can be no feedback loop so we are left with the question "How is it so"? The answer is a giant step towards Gnosis.
Returning to the charts we can simply say that all ranges even across different time frames are fractals of each other and the specific fractals we are concerned with will occur as Daniel ratios. Notice here that we are sliding across time frames and using price matrices 10 or more years apart but creating the same numbers (+_0.5%).
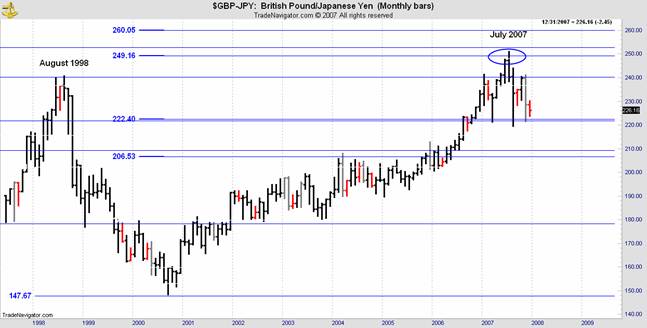
Having found the April 1995 low with both our quarterly and monthly Daniel price projections we place the upside monthly projections on the chart. The market ignores our first three projections before finding the August 1998 top at 240.91 against our target of 240.22. These projections are created contemporaneously from the 1995 low. We are not "reading" the market as it evolves.
As we move the chart along we follow the same process to forecast the September 2000 low price targets. There are just three targets over the two years the market took to find its low at 148.25, less than a point from the Daniel number at 147.67! The numbers it bypasses on the way down are "recognised" on its rally to 2007.
All the way up, the market is vibrating around these Daniel numbers created in 1995!!
Finally we add the Daniel sequence from the September 2000 low and get several important price targets including the 2007 high with exactitude!!
Was this worth knowing?
Weekly
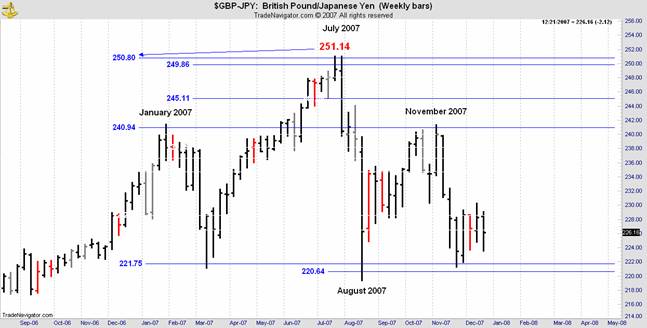
We already have the 2007 high and all the vibrations around that high in the chart above. Will the weekly Daniel numbers blend as seamlessly into the monthly prices as they did with the quarterly prices?
Here it is:
We get every turn both highs and lows from just the January 2007 price matrix. We haven't used the numbers embedded in this formation before so these are new numbers.
Daily
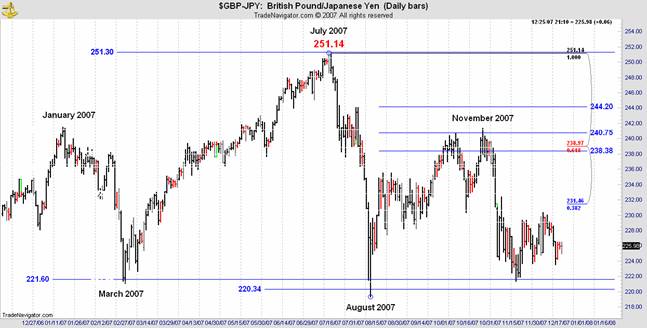
The daily chart utilises the weekly Daniel numbers and creates new price levels from its own swings. We start our daily chart from the January 2007 high which creates our target for the March low. The March low creates three upside targets only one of which is recognised; the July top just 16 ticks from the Danielcode target!
That high itself gives us the targets for the August low. The fast move dives to the old Daniel number at 221.60 and the very next day makes its August low by breaking to the next number in the sequence at 220.34 before rapidly reversing. These two numbers are created from the January and July highs respectively. They are both valid. Importantly the 221.60 number was recognised by the market in its plunge from the July high albeit for just one day but that is the momentum low for the July-August move. It continues to be recognised as the next low in November again reverses off 221.60.
The secret Daniel numbers are recognised by the market repeatedly. From the August low we had three Daniel numbers in the next upside sequence. I have left all three targets on the chart above so you can see the recognition process. It's not hard to determine which is active as the second target at 240.75 turns the market at 240.69 just 6 ticks from the target on October 15th and is retested at 241.38 on November 1st.
I have added Joe Di Napoli's fib indicator to the next chart to show you that the Daniel numbers are NOT FIBS.
Although fibs don't usually fall close to the Daniel numbers, in this piece of range trading they do. The nearest fib is close by at 238.97 against the Daniel target of 240.75. These levels are so close that they are of interest only to day traders but it provides an opportunity to compare how these contrasting numbers work. Fibs usually don't get near to the turns on longer term chart but they can be relevant in trading ranges. Fibs are "sometime" approximates; Daniel sequence numbers are constant and precise!
In this example the fib required you to make choices if a reversal was occurring on 16 separate days where price intersected the fib in the red box. The variances from the fib were up to 4 points. At the Danielcode number you had to make the same decision just twice; both days caused significant reversals and the variance was less than 50 ticks. In fact it was only the 2 days that reached the Daniel number that stopped the rally. If we exclude those 2 days which responded to the Danielcode, none of the remaining 14 days that intersected the fib provided a reversal!
Which of the above choices would you have preferred? 16 daily decisions on whether the fib was active or just 2 to catch both turns against the Daniel number with only 50 ticks of variance?
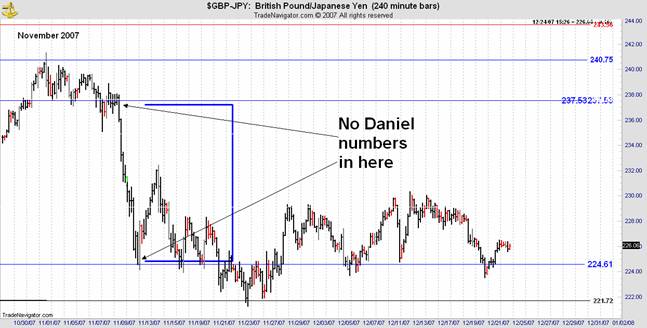
240 Minute Charts FSO seems to have a significant following of traders who have asked to look at 4 hour charts. This is not relevant for investors and hedgers but in the spirit of transparency and opening up the Danielcode to critical examination I set them out below. The first chart is simply the daily chart with its Daniel numbers converted to a 240 minute chart.
The interesting feature is the fast move from the 237.53 number to the next Daniel number at 224.61. The fast move happens where there are no possible Daniel numbers! Does this tend to validate my opening statement? Is this why fast moves happen when they do? Can we expand the hypothesis to say that markets actively seek the Daniel numbers and fast moves happen in their absence? Was this worth knowing?
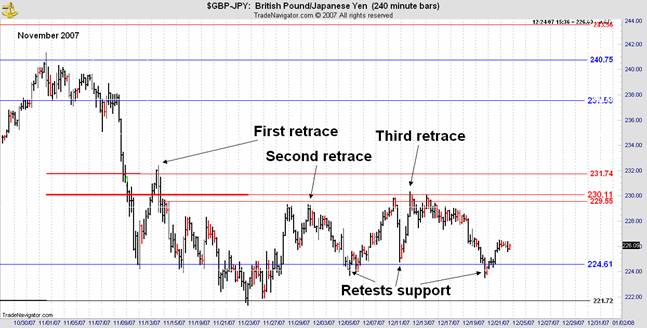
Having got our fast move we add the Daniel retracement numbers. These are in red. Our first retracement level is at 231.74 and we get the first retrace almost perfectly. The market then retests the previous Daniel number at 224.61 twice before breaking to the last level of Danielcode support for this swing at 221.72.
We now need the retracement levels from the 221.72 low. There are two possible swings to correct from the November high. The chart below shows the second retracement. Its highs are just 20 ticks from target.
And finally we get a test of the Daniel fractals of the larger swing before the market collapses back again to retest the old support at 224.61.
We actually get the "Retests support" level more accurately with the red retracement price level on the following chart at 223.61 and the little bounces thereafter continue to vibrate through these minor Daniel numbers.
The largest divergence from the Daniel targets is less than 1 point. Most are less than 50 ticks, so the precision we saw in the longer term charts is manifest in this time frame also.
If you are starting to agree with my opening hypothesis, go to the Danielcode website to learn more and see all the Daniel numbers. There is a large selection of currency crosses available. If you are still skeptical that this new and unique analytical insight supports my claims, I will continue to try and persuade you in subsequent articles.
© 2007John Needham


