


Gold Vigilantes
Last week the gold vigilantes launched their attack by nominating me for their annual "Moron of the Year" award after my earlier Financial Sense article "RIP Goldrush" (see FSO archives) was belatedly recycled into a popular pro-gold, pro-GATA newsletter and used to whip me mercilessly for having the temerity to suggest that "markets fluctuate; sometimes violently". One of the besieging emails was polite and stated the writers deeply held beliefs on "the great gold conspiracy" so beloved as a marketing tool by those who profit from the sale of the physical asset. My subsequent correspondence with him to ascertain the source and reason for the conspiracy beliefs eventually landed full circle on the creators and marketers of this hype and fizzled into the usual take of "I believe it because those guys say so".
The other vigilantes created a storm of emails featuring various profanities and obscenities. In common, none replied when I politely asked them to point to some material support for their argument. The standout was a registered hedge fund who stated "We did a ***** report on gold manipulation three years ago you blink blink moron"!! Unfortunately, merely authoring a report even one with scholarly support (which this example wasn't), does not make it right as Long Term Capital Management and more recently various SIV creating banks have found to their cost.
Strangely, none mentioned that if they had followed the Danielcode reports on Financial Sense, they would have been alerted weeks earlier to the high probability target for gold at 1034.10 (see Prophesy! in FSO archives).
Lovers and Traders
Big traders make big trends and this year we have seen a good few of them as the educated money has rolled out of stocks and property, into Gold and Silver, Oil, Corn, Soybeans, Rice and Wheat then out of Gold and Silver into the Dollar, gradually out of the grains and back into stocks with a nibbling of interest in the precious metals.
Oil has surpassed them all with its relentless surge from $12 at the end of 1998 to its peak this month of $135. Markets are made up of two disparate groups; traders and lovers. Traders think with their brain and theirs is a world of numbers, volume, trade reports and industry intelligence. They rarely own the physical asset underlying the tradeable market, preferring to avoid the costs of warehousing, insurance, physical maintenance and government charges such as stamp duty. Because they are not emotionally invested in the real asset they have no attachment to it. It is just a tradeable commodity.
 Lovers as you may surmise become emotionally attached to the physical asset that others trade. This virulent infection is particularly prolific in two classes of asset, property and gold. For the lovers these are not markets but chattels of ownership. They are invested with mystical (and unfortunately mythical) qualities of strength, comfort and security. We all know "property" men. Those who believe that property prices always increase and that property is a store of everlasting value. They overinvest in a single asset class and some, being subject to the same endless media hype, forget those hard learned rules that they so assiduously plowed at the beginning of their investing career and succumb to the self reinforcing feedback loop of rewards that markets create to initiate and prolong trends.
The human psyche being frail seems to need to constantly defend its "id" driven decisions, so not only is the selected asset class elevated to the status of a deity but those who don't agree are decried.
At some stage this feedback loop itself becomes the investment motivation. "My property investments appreciated by 20% last year. It's safe. I made money. My forecast is that nothing will change, so markets will be up another 20% next year"! And so they were for many years and brave investors were handsomely rewarded. Those who had considered and planned an end game were big winners. They were predictably few.
Gold lovers have an even deeper attachment to the asset than property lovers. For many of them physical gold is their ace in the hole; their talisman against future chaos and strangely the perception that it is an effective hedge against their own government's calumnious behaviour. And well it might be.
 I have documented the inverse relationship between gold and US Dollar in previous articles. The enduring nature of this love affair is what I question. W H Auden summed it up best "I thought love would last forever; I was wrong". Is it heresy to suggest that gold will have market fluctuations like all markets? I think not. Here is the long term chart of Comex Gold.

The Danielcode's prescient call for a significant market turn at 1034 is now history. What is worth some serious thought is how the price structure around the May 2006 high forecast the price of the March 2008 high. Indeed how did the Danielcode forecast the 17th March low in the Dollar (DX) in the Financial Sense pages long before it happened? Understanding the unalterable nexus of markets is always our task.
From this gold chart we see that the market topped where and when it should, retraced almost exactly 50% of the last drive from where the fast move started and made its low against the old 2007 high. Classic market behaviour. WD Gann pointed out that in trending markets old highs become lows or support. So far the correction has been unemotional apart from the first week of the downturn, orderly and looks decidedly corrective. Gold bulls, like Oliver Twist have reason to ask for more. Importantly the Daniel number sequence that brought in the March high comes from an intermediate price structure so our present conclusion is that there may indeed be more for the bulls later. At present there is no evidence that government has loosed its grip on DX and for traders, that relationship is key.
Oil
For Oil, there is evidence to believe that at least an intermediate turn in Oil is to hand and Thursday's turn is more than just one day down. On 9th May I published the following chart and comments in "Jokers Down Under" on Financial Sense:
Oil continues to charge up the chart and after pausing for a day or two to recognise the 123 DC level it has burst decisively through that level. You can see that the dark blue Daniel number sequence has dominated this chart since its 2007 low. The next major price level from the weekly DC charts is around 130.

Can the Danielcode charts really create exact price levels where markets will react, days and weeks and years in advance? Apparently so. The chart above created six Daniel number price levels all part of the same DC sequence and all created from the dominant 2006 price structure. The first level at 82.52 stopped the market for four weeks; the next at 99.32 turned the market and held it for fourteen weeks and then became support for three weeks; 111.26 stopped this market cold and turned it back to the previous DC number; 123.20 was recognised for just 48 hours and 130.28 was ignored so these will likely become important support levels to Oil in the future; and 135.14 has today turned back Oil!
Interestingly on the monthly chart we had 2 degrees of DC numbers also targeting the 134/135 area.

On the shorter time frame I highlighted Oil's position on the regular charts and comment posted at the Danielcode Online. This from the website: On the July chart there are multiple targets at 135.70 to136.70. There is also a weekly target at 135.14. Strong resistance. Thursday's high was 135.09. Close enough? Nothing in the Danielcode tells us it this turn is temporary or terminal. Only price action will reveal that but it was a nice trade both ways if you knew the numbers.
S&P, the Dow and other Indices
Danielcode traders had all the advantages in trading the equity indices this week. Arguably the ultimate knowledge for traders is to know with a high degree of probability the price levels at which markets will turn and the time for those turns. The Danielcode is without peer in forecasting likely turning levels for markets but recently we have added a little spice to the mix with our new time turn indicator called T.03. This signal alerts traders that relevant markets are primed for a turn as the requisite time has run. For the S&P, our traders started the week flush from picking Friday 05/09 turn up from 1383.70 against its Daniel target number of 1384.50. The high and the low of the week so far have been made at precise DC price levels posted for members. In addition we had a T.03 turn date for Monday 19th and in case the intraday turn was ambiguous, another turn date for the next day signaling lower price action forthcoming for the S&P. And so it was as the following members chart with its DC numbers and posted comments shows:
The star of the show this week. Made its intraday turn on Monday just 3 ticks from the DC number and Wednesday's low was at the black retracement to the tick! Think these markets know the DC numbers?
A daily close below 1388.50 which is the last level of Danielcode support for the current swing implies more downside price action.

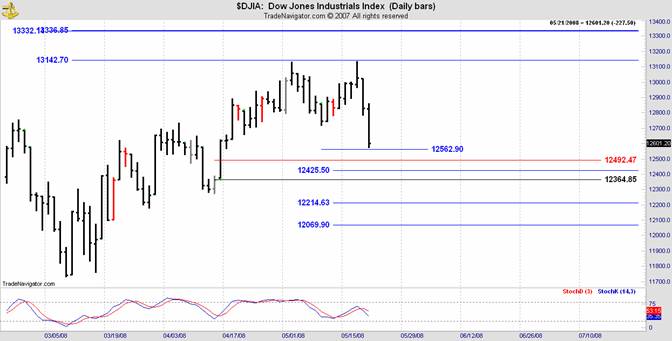
As we have both futures and options traders following the Daniel number sequence I produce futures charts for the former and cash or index charts for the latter. Usually one or the other will be more precise but this week both the Dow index and its futures chart competed to show us their intimate knowledge and adherence to their DC sequences. This is the index chart with comments from the midweek update:
HOWZAT! Monday's high was just 6 points from the DC target and Wednesday's low was 12 points from the first price level. Neat enough so far.
And the futures chart:
The futures was even neater than the index. Monday's high at 13140 was 1 point from the DC number.

Even our newly introduced Russell 2000 charts played their part as the Russell too turned at its nearest DC number.
Perfect DC turn. No change.

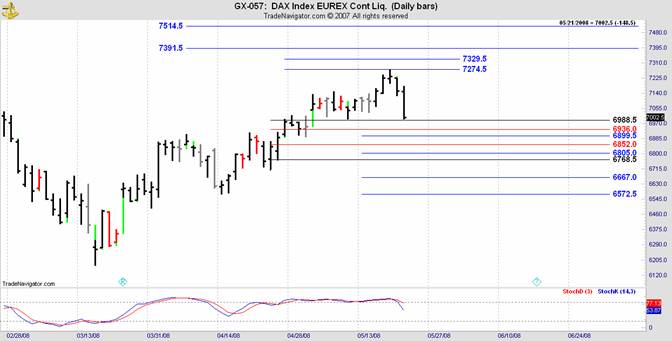
So if we truly understand the market nexus we should be able to forecast the turning points for those other major indices the German DAX and UK FTSE. Indeed the Danielcode speaks all languages as the following chart created for our European clients shows.
Nice turn Monday just 4 points from the target. Now at the 50% retracement of the minor range.
Would your trading have been helped by knowledge of these numbers?
For every index we cover the DC turns were precise and posted well in advance. The runs of the S&P and Dow in the past fortnight have been powerful and profitable but you have to know the numbers that will mark the turns. The trade isn't complete until the money is in the bank. This imperative requires knowledge of endings as well as beginnings.
These skills are equally applicable to shorter term traders and long term trend followers. Before the trade goes on you must know your trading horizon and have a strategy in place that will capture your profits at the timely point. We do this for our clients constantly with the Danielcode.
This year it has marked the highs in gold and silver to a few ticks. Not points-ticks! It forecast the March low in DX to 40 ticks, the high in Rice and Corn and now is signaling that a significant turn may be here for Oil.
In financial markets love does not conquer all, so even the greatest lover needs to know how to tell when a trend is over. At the very least trend followers need to have a strategy to deal with the end game. Shorter term swing traders also have to know when to step off the ride, and daytraders always have their exit weapon primed and cocked.
Consistently, markets turn in all time frames at the Danielcode numbers as these articles demonstrate.
I invite you to visit the Danielcode Online website where members can get all the Daniel numbers for the wide range of markets we cover. Over 400 FSO readers last week took advantage of our offer of a 10 day free trial of the Danielcode numbers. They came at the right time as volatility expanded nicely in many markets and we again had the targets for all the important turns in almost all of our markets. There are a number of free charts of International markets available.
For my US readers I wish you a pleasant and peaceful Memorial Day weekend as America honors its fallen warriors, a ceremony undertaken down under annually on ANZAC day, 25th April.
For you lovers of all things property and gold I leave you with Dorothy Parker's thoughts to ponder, all the more powerful for coming from the other team. Part of our trade intelligence is always to know what the other side is thinking. Here it is:
By the time you swear you're his,
Shivering and sighing,
And he vows his passion is
Infinite, undying -
Lady make note of this:
One of you is lying.
- - - Dorothy Parker "Unfortunate Coincidence"
Copyright © 2008 John Needham


