


While the property and asset bubble party continues unabated down under, one of the better yarns which is rapidly fading into the mists of time involves two young Sydney lawyers, the splendidly named Roscoe WG Hoyle and Bill Dovey. Both were keen rugby men and after a particularly hard fought match circa 1928 and the mandatory refreshments and celebrations that followed, Messrs Hoyle and Dovey accompanied by their mates decided that a midnight sightseeing tour of the unfinished Sydney Harbour Bridge was in order. The final span on the lower arch had not been placed that night and our heroes entered the annals of legal mythology with a daredevil leap across the unfinished sections about 134 meters or 240 feet above the Harbour.
This early photo of the old Manly Ferry Dee Why passing the uncompleted Sydney Harbour Bridge in about 1930 is a memorable snapshot in time. You can see the final spans of the “coat hanger” being laid. It will also give you an idea of the risks our fearless heroes undertook.

Happy endings ensued for our boys as both lived to a ripe old age. Roscoe Hoyle was a celebrated and much loved Solicitor (Attorney) in Sydney and was my Master Solicitor at a time when young lawyers were indentured to undertake 5 years of clerkship or pupilage before being turned loose on an unsuspecting public. Bill (Wilfred) Dovey eventually rose to become Mr Justice Dovey, a Judge of the Supreme Court of NSW in its Divorce jurisdiction in 1953. His daughter Margaret married Gough Whitlam later to become a controversial Prime Minister of Australia. The building of the iconic bridge and Hoyle and Dovey’s leap into history ended famously. The ongoing flirtation with an equally elevated risk in Down Under asset prices, residential housing and NZ farms in particular will not have such an idyllic sunset.

Australia’s Fed Preaches Caution to No Avail
The Reserve Banks of Australia and New Zealand are the US Fed’s counterparts. I see many of the same problems between the lands Down Under and US, but on a delayed time line. Much of US and all of Australia and its near cousin New Zealand are matching Hoyle and Dovey’s derring do as they teeter with unsustainable house prices near 8 times average earnings fueled by generational change in valuation and lending standards that will not be remembered fondly by those taking or about to take a very cold bath. With an historic asset bubble (Australia and New Zealand have been described by OECD as having the highest house prices in the world relative to household income) and record trade deficits, one would assume similar responses from the respective central banks.
Not so! As the US Fed slashes rates to keep at bay the credit crisis which traces to overzealous lending that fueled the US housing boom, the Australian equivalent the Reserve Bank of Australia raised official rates to 7% on February 9. The Four Pillars (see my FSO archives) unusually preempted the Reserve’s move by again raising home mortgage rates, now at about 9%. The New Zealand Herald reported in January:
The US credit crunch has finally hit New Zealand home-buyers directly in the form of rising mortgage rates. Westpac yesterday raised its fixed rate mortgages by 20 points, taking its two-year fixed rate from 9.4 per cent to 9.6 per cent. The increase matches moves by New Zealand's largest bank, ANZ National, within the last week.
In this politically sensitive area, the RBA, post Federal election felt itself sufficiently unshackled for its Governor Glenn Stevens to say:
"…the risk of inflation remaining uncomfortably high for some time is considerable. Absent a further shift in economic risks to the downside, therefore, monetary policy is likely to need to be tighter in the period ahead," It cautioned then that the economy would have to cool significantly to restrain core inflation, which hit a 16-year high of 3.6 per cent in the fourth quarter of 2007. NZ Herald 11 February 2008.
The interesting thing about elections is that the incoming Government always seems to make amazing discoveries that were unknown before the elections. Kevin Rudd, the incoming Australian Prime Minister has declared "war" on inflation as his No1 priority in the first year of Labor government.
The Australian of 9 February trumpeted
’GET ready for the Big Squeeze. Australia has been on a spending binge over the past several years, but that's about to change if Reserve Bank boss Glenn Stevens gets his way. Since the China boom really got going six years ago, spending in the economy has consistently outpaced production. The result has been a ballooning import bill and a worrying inflation breakout above the Reserve Bank's 2-3 per cent target. Kevin Rudd (sic Australia’s new Prime Minister) has declared "war" on inflation as his No1 priority in the first year of Labor government. And this week the Reserve's Stevens fired a 0.25 percentage point increase in official interest rates directly into the lounge-rooms of the Prime Minister's highly leveraged "working families". They are now paying the highest mortgage rates for 12 years. "This one will really hurt," said Rudd.’
The Australian Newspaper of 9 February fleshed this out.
A Reserve Bank graph shows overall demand in the economy growing by about 5.5 per cent over the latest 12 months. That's in "real terms" taking out inflation. And it includes spending by governments. Taking this out gives private demand, which is growing by a frantic 6 per cent. Access Economics director Richardson reckons the excess demand gap will actually widen over the year as higher mining export prices and billion in tax cuts from July 1 pump money into the economy.
As countries highly dependent on mining and rural exports should inflation be a surprise with these charts freely available? These are from Danielcode Online. This is the CRB index:

And Oil

And Corn, all with their Daniel sequences.

Food costs world wide are rising at staggering rates and the argument is now being made that biofuel policy (there’s Needham’s Law # 3 again) is combining with fuel as basic cost inputs to cause hardship in less privileged parts of the globe. What we are seeing is really a change in sentiment as commodities have been on a tear since 2001. Bloggers and alternate forum economists have been making the case for years that inflation was roaring and only government statistician’s hedonics kept the official figures in check. Why does it matter to our central banks and politicians now?
A Volcker Moment
’I overstate it, but the traditional method of making small moves has in some sense, though not completely, run out of psychological gas. Every time the interest rate goes up by a small amount [bankers] say okay, we'll raise the prime rate. Whatever you do is inadequate -- you, the Federal Reserve -- and we'll go along. We have access to liquidity at a fairly fixed federal funds rate -- the rate isn't going to change all that abruptly -- and you're not having much impact on market thinking or on market confidence in your ability to keep the money supply under control.’ Paul Volcker. US Fed minutes: October 6, 1979
President Jimmy Carter’s Fed Chairman Paul Volcker educated generations of Central Bank rulers with his 1979 statement which has been well learned. The Reserve Banks Down Under continue to play the game. With asset inflation maintaining its double digit pace, official inflation figures continue to understate the problem. There is a continuing disconnect between what the government says and what the public “gets”
When it comes to car sales, the Reserve Bank's efforts to dampen demand through successive interest rate rises has clearly failed. Every single month over the past year, sales records have been broken, leading to an unprecedented million new cars hitting the roads in 2007. Figures just released show new vehicle sales in January, up 6.9 percent. The latest increases followed on from an exceptionally strong December, which saw sales increase 11.9 per cent on the previous December. The luxury end of the market is doing particularly well. Sports car sales have increased by 23.4 per cent. Petrol-guzzling four-wheel-drives have also seen dramatic sales increases, demonstrating the lack of concern among certain consumers over ever-increasing petrol prices. The luxury segment of the 4WD market increased by 27.9 per cent last year. "Sales are up substantially for more expensive motor vehicles. The big spenders are spending like crazy and interest rate rises are having no impact on them. We have never seen trading volumes so high." Australian Business 9 February 2008.
Got that? Never. This is the daddy of all spending bubbles. Much of this extravagance is a result of taxation incentives. I haven’t yet discovered why builders, accountants and business men in general require Mercedes, BMWs and Range Rovers for their business vehicle. It must be more efficient for the business to carry your files in a luxury vehicle but I am yet to be convinced.
And in New Zealand, the Government has discovered that 50% of its greenhouse gases are emitted by ’large bovines’ that is the country’s dairy cows. Apparently this is a sign of affluence or at least of no concern to dairy farmers as the NZ Herald of 27 January 2008 reported
’...the rural property market has discovered a new gear. Pushed along by record dairy payouts...dairy farm prices have been particularly strong, reaching a record median of .575m in December, up from .5m the year before (+43%). Real Estate Institute of New Zealand rural spokesman Peter McDonald said the rural sector had reached a new level as farmers and new investors were competing for properties in a sector with "unprecedented growth".
To give you a comparative time line with recent events in US markets, Professionals Real Estate in Wellington, NZ was phlegmatic about the region's market.
"People have been spoiled, no doubt about it. We got used to growth of 13 to 20 per cent every single year, for year after year. Anything which drops to single figure growth feels small but it's still good."
Sound familiar? It should.
Government and media continue to present fiscal policy as restrictive. ’When we've had 11 interest rate rises in a row, borrowers start feeling a bit of pain.’ they say. Those 11 rises produced a total increase of 2.75 percentage points. Volcker was right. Consumers and property punters think RBA policy is toothless and they have history on their side. We hear the same story year after year and the tiny baby steps of 25 point rises goes on. If any Central Bank anywhere is serious about its inflationary obligations it can take a lesson from Messrs Greenspan and Bernanke who have demonstrated the corollary of Volcker’s Law; when you are serious, give them heaps! If a 50 point cut won’t do it give them 75 point cuts. Oh, and try to do it on options expiration day to drive home the point!
The political reality is that a serious attack on spending and inflation is not going to happen folks. To take control of our out of control spending party which has been endemic for years we need a man of Volcker’s considerable stature and backbone. That man is not on Southern horizons. I guess it is easier to let it roar out of control until the tipping point and then say guilelessly ’WE didn’t know it was a bubble guys!’
If there is to be pain, Down Under consumers are not feeling it yet as the buying binge goes on unabated.
NZ Valuers
The Dean of NZ valuers, reports that a number of property valuers are feeling pressured over past and current appraisals. We have seen the same story prominently reported in the US, but media scrutiny down under of property matters is non existent. The size of the property supplements to weekend papers shows what a cash cow to the print media the ongoing boom is. These guys are not going to bite the hand that feeds them. My adviser is a seasoned and sober observer. He is not usually first with the news but you can rely on the fact that if he is concerned, things are nasty. Is there a problem with appraisals on all those two year mortgages coming up for rollover?
Uridashi!
Followers of my Uridashi! article will be interested in the latest charts from the NZ Reserve Bank. After the publication of that article in Financial Sense I was contacted by a retired Kiwi banker/bond trader who worked for many years at the heart of the Uridashi trade in London. I am indebted to him for the insights he provided. One of the many points that he alerted me to was the rapid growth of Kauri and Kangaroo bonds in NZ and Australia respectively. These new bonds have a comparatively small issuance but you will see from the Kauri bond issuance chart, second below that the issuance rate is vertical. He also stressed the swaps trade that backs these bonds against USD.
The key difference between Kauris (named after an historic and unusual NZ tree), their Australian cousin Kangaroos and Uridashi is that the new bonds are issued onshore and are eligible for REPOS. Bankers and bond traders will understand the significance. The converse is that billion of Uridashi are not. Think about that for a while. The complexities of this trade are beyond the scope of this article but the observations are nuanced and interesting. The chart below is self explanatory. Offshore issuance is down.

New Kauri issuance almost exactly matches the reduction in offshore bond issuance so NZ is replacing Uridashi with Kauris. Kauris have a notably longer term than Uridashi. This strategy is aimed at alleviating the redemption choke points I highlighted in URIDASHI! Is it too little, too late?

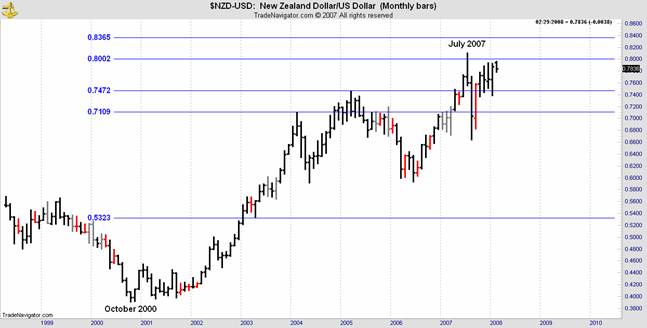
The total of offshore dollar bond issuance plus Kauris has reduced. The correlation to NZD-USD is part of the trade.

The NZ Reserve Bank thinks the relationship between NZ dollar bond issuance and home prices is important! Which is pushing which?

The NZ Reserve Bank website has an interesting discussion on how swaps back this trade against USD. With the NZD-USD cross still holding at a high level negative sentiment on USD and rate differential is still the story.
The Next Shoe Has Dropped
So consumer spending Down Under remains rampant. Expensive luxury cars are all the rage and near 50% price increases in farms still have buyers scrambling to get into the act. Home buying is frantic. My countrymen, the modern day counterparts of Hoyle and Dovey will jump any bridge any time to get their hands on a piece of property or a new car. As I have argued before, the twin valkyries of the bubble are cost and availability of finance. Cost, we have seen is not yet across the pain threshold and availability is still plentiful as the Four Pillars subscribe to the ’China will save us’ myth. A sobering thought on the horizon is provided by Ambrose Evans-Pritchard the respected chief financial writer for the UK Telegraph. Evans-Pritchard led with this story on 10 February which although in a UK paper is particularly relevant to the Down Under bubbles:
Japan is the next sub-prime flashpoint
There is still 0bn of bad debt out there, and Japan could be hiding most of it. Just as battered investors had begun to glimpse signs of recovery in America, the next shoe has dropped with an almighty thud in Japan. Echoes are rumbling across the Far East.
The nagging fear is that Japan's lenders - the conduit for the world's greatest stash of savings - have taken on a far bigger chunk of mortgage securities, collateralized loans obligations and other exotica from America's structured credit boom than they have yet revealed.
Americans and Europeans have so far confessed to 0bn of the estimated 0bn to 0bn of wealth that has vanished into the sub-prime hole. Somebody, somewhere, must be sitting on a vast nexus of undisclosed losses. The iTraxx Japan index measuring default risk of 50 Japanese companies saw its biggest one-day jump ever on Thursday to 77.5. Rightly or wrongly, it is flashing a serious distress signal. So far, Japan's biggest three banks have admitted to just .7bn in total losses between them. The figure is rising. Mitsubishi, the biggest, has just raised its tally to 12 times the sum admitted in November. So the storm spreads East. Once the striptease starts on the onset of a global downturn, it usually has a long way to run.
Remember this is the source of Down Under’s great debt binge. Australia’s savings rate went negative years ago (see my FSO archives). The Down Under party is all on borrowed money. I like the odds of this scenario playing out. I am not in the camp that says 0 billion of wealth can be destroyed with no consequences. I like the idea of the next shoe dropping. It matches the scenario I have been painting in previous articles. With US and European funding becoming more expensive for Australian banks (NZ banks are the same banks) and the Uridashi game perilous because billion of them are not eligible for repos and therefore beyond the Reserve Bank’s safety net, are the great South lands about to crash at their next bridge leap?
I think it inevitable.
Danielcode Trading
Danielcode traders don’t care which way markets are going. Short trades pay exactly the same as long trades. What they care about is the precision of the secret Daniel number sequence which defines all markets, is recognized by markets and is unknown to others. This is the edge you have been seeking. In my ’Charting around Asia’ column published on the Financial Sense ASIA page today (2nd tab from right at the top of FSO main page) I show the major Asian markets and their Daniel numbers. They are tracking them scrupulously. The Asian Daniel charts are available to all at the Danielcode Online website.
A tough grizzled old trader (and Attorney) from a very major US securities firm put it bluntly when he wrote to me this week: Great job. I made a major hit on the short in USH over the last week. MP, USA. Indeed he did with the Daniel numbers on the T Bonds chart below. Did you have these numbers?

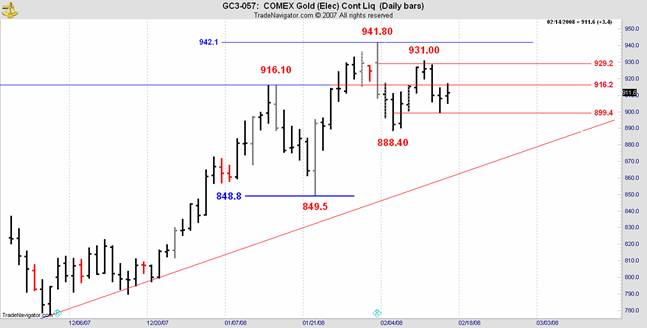
Our Gold traders continue to trade the Daniel numbers with exactitude. Since I began publishing the Daniel Gold charts every turn has been made with precision at a Daniel number. The largest variance from target is 1.8 points!
The Dow Jones and S&P indices continue to follow their Daniel script

And longer term investors and corporate hedgers are taking advantage of the accuracy of the Daniel weekly charts:
The universality of these extraordinary numbers is being acknowledged by seasoned veterans of the markets who have seen it all as SBL from USA wrote to me on 13th February: I got to tell you that the Danielcode is incredible! I've been trading derivatives for over 10 years and FX for about 2 and always found it difficult, even with indicators, to tell if a change is direction was indeed valid. I've seen very positive results. Took 4 trades in the last week - 2 on the EUR/USD, 1 on the GBP/USD and 1 on the USD/CAD; three all were winners and the fourth is profitable and still open. The 3 closed trades saw 316 pips total and the open trade is up by 66 pips -- 382 pips in 1 week. Can I say more?
And by newcomers as JG and MTV from Andorra attest: I'm very surprised and amazing with Daniel numbers, and really congratulate you for having found the way to adapt them for financial markets and:
I am twice happy to have enrolled, I already closed 2 fast "test" trades in GBPJPY,using H4 LEVELS, at a profit, one yesterday, a short at a DC level 210.77 area, once confirmed by price action, and the other today, a long from a dc level area 209.85 to yesterday’s dc level where I took profits. Thanks a lot for your excellent levels, I mentioned them to a friend of mine from Spain, and I believe that he subscribed too, keep up your exceptional work, it is really something extraordinary.
Incredible, amazing, exceptional, extraordinary? Indeed they are. The Daniel numbers are unique. In MTV’s comments he refers to the H4s. These are the 4 hour Daniel forex charts. Some are set out below so you can see how price moves between the Daniel numbers. These price levels are posted days in advance so subscribers can plan and be prepared. They are accurate to 40 ticks (pips).


All markets trade the same by obeying the Daniel numbers. Weekly, daily, 4 hourly. Equity indices, bonds, Gold and forex. I have shown you posted examples of them all. Are you ready for the knowledge the Daniel numbers bestow? If so I invite you to learn of the discovery and origins of this historic number sequence from earlier articles at my FSO archives and to visit the Danielcode Online. There is much to learn.
Copyright © 2008 John Needham


