In the never ending quest to find reasons "why" the market will rise in any given year - investors routinely grab at a whole variety of indicators that seem to have some correlation to the future outcome of the market. Hemlines, hair styles, skyscrapers, lipstick, Wall Street jobs, Sports Illustrated Swimsuit covers, cardboard boxes and the Big Mac index top the list of the most bizarre. However, there are three that tend to generate more press than the others: the first five days of January, the decennial cycle and the Presidential election cycle.
So Goes The First 5 Days Of January - So Goes The Month
The theory goes that if the first five trading days of January are positive then the entire month of January tends to be positive. From there comes part two of the story which states that "so goes the month of January, so goes the year."
Bespoke Investments recently stated that:
"Going back to 1945, this year's gain of 4.3% is tied for eighth place as the S&P 500's best start to the year in the post WWII period. Looking at prior years where the index rallied more than 4% to start the year, the S&P 500 has averaged a gain of 1.36% in the last week of January with positive returns ten out of twelve times (83%).
The positive returns that we typically see in the last week of the month following strong starts to the year stand in stark contrast to what we have seen in more recent history. In the ten years preceding 2012, the S&P 500 started off the year with an average decline of 1.55% through 1/24, and saw positive returns only 40% of the time. Collectively, these lackluster starts were followed up with limp finishes to the month as well. Since 2002, the S&P 500 has seen a positive final week of January only three times for an overall average decline of 13 basis points (bps)."
"With the S&P 500 already up more than 4% this month, it is more than likely that the month will finish off in positive territory. That being the case, in the table and chart below we show how the S&P 500 typically performs from February through year end based on the returns seen in January.
Looking at the overall numbers, there is a reason why they say, 'As goes January, so goes the year.' When the S&P 500 is up in January, the S&P 500 has historically gone on to average double digit returns for the rest of the year with positive returns more than 80% of the time.
Negative Januarys, on the other hand, don't leave investors with very much to get excited about. When the S&P 500 is down less than 5% in January, the index averages a gain of 0.03% for the rest of the year, with positive returns 55.6% of the time. Ironically, three bps is equal to the yield you'll get on a three-month t-bill, but you aren't going to find many people willing to invest in equities for an expected return of three bps.
There is no denying the positive psychological impact that a strong start to the year has on investor psychology. While a lot can and certainly will change over the course of the next eleven months, this year's strong start at least points the market in the right direction. Now, bulls just have to hope that any bumps that arise don't knock the market too far off track."
However, as with all indicators there is also the other side of the story. Mark Hulbert wrote this article debunking this indicator.
The Decennial Cycle
In his book Tides and the Affairs of Men (1939), Edgar Lawrence Smith presented the notion of a ten-year stock market cycle.
When Smith investigated prices more closely, he found that indeed there appeared to be a price pattern in the stock market that had similar characteristics every ten years. This pattern has since been called the "decennial pattern."
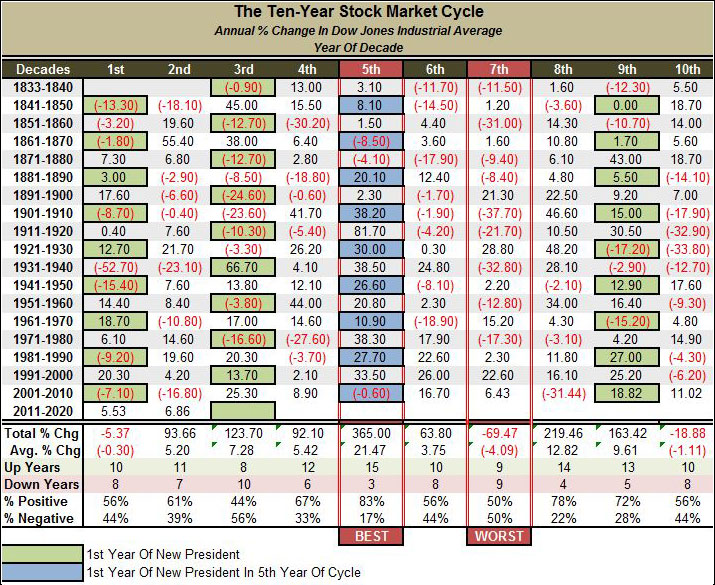
Historically, the decennial pattern theory showed that years ending in 3, 7, and 10 (and sometimes 6) are often down years. Years ending in 5, 8 and most of 9 are advancing years. The 5th year of the decade has been the best performing and, until last year, the 10th year was the worst. With the 11% advance in 2010 the worst performing year has now shifted to the 7th year of the decade as shown in the table below.
As we enter into the 3rd year of the decade what do the decennial trends tell us about the probabilities of stock market returns in the coming year. The 2nd year of the decade has been positively biased over its history turning in an average return of 5.15% by being in positive territory 11 out of 18 times. Therefore, 2012 fell in line with statistical norms with a positive return of 6.8% while the S&P 500 fared much better rising 12.99%.
As shown in the table above 2013 is anything but assured. While the average annual return in the 3rd year of the decade is positively biased, rising 7.28% on average, the market has been negative 10 out of 18 times leaving only a 44% chance of being positive. However, if 2013 does turn out to be a positive year the average gain in winning years has been a whopping 29.98% versus an average of -11.7% in losing years. However, the positive return rate is skewed by the 45% gain in 1843, the 38% return in 1863 and 66.7% surge in 1933. If we look at the median return of the 3rd year of the cycle the 7.28% positive return drops to a -2.1%.
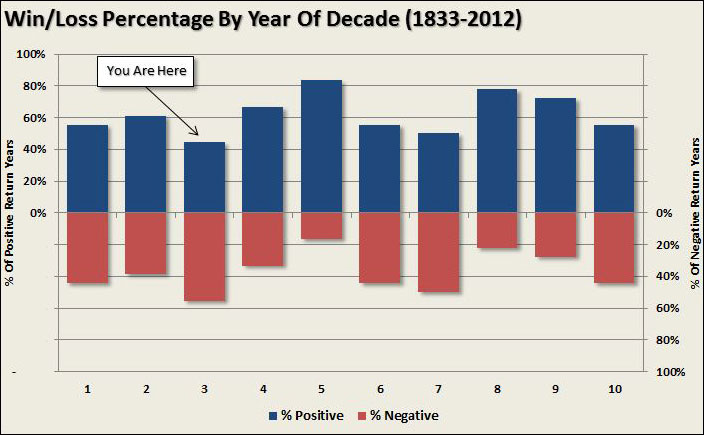
The chart below shows the win/loss percentage by year of the decennial cycle. As you can see the odds of a positive return year in 2013 are some of the lowest of the cycle.
However, 2013, as we will discuss more in moment, is also the first year of a new Presidential cycle. The green boxes in the table above represent when the 3rd year of the Decennial cycle coincides with the 1st year of the Presidential cycle. Statistically speaking, when these two cycles overlap, there is a 77.7% probability of a negative return year with an average loss of -13.3%.
Presidential Election Cycle
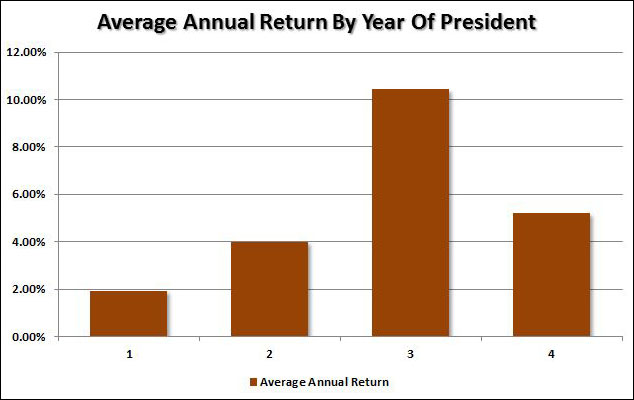
The Presidential Cycle was a theory developed by Yale Hirsch that attempted to corrolate the four years of the Presidential term to the movements of the stock market. That theory is based upon the idea that the market responds to the fiscal and political policies implemented in Washington due to their potential impact on the financial markets. Historically, the markets have been the weakest during the first year of the Presidential term but improves in the subsequent years before fading as the term comes to an end. This is shown in the chart below.
With Obama set to take center stage on January 20th to be sworn into the oval office - the market, and the economy, are likely to be wrestling with the continued debate, and drama, from Washington.
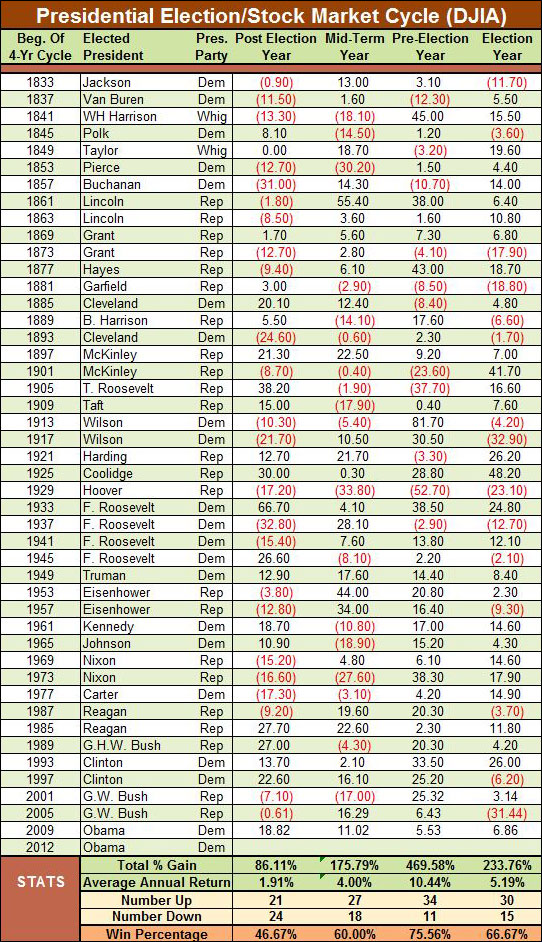
As stated above, the first year of a new President has been just shy of a coin-flip in terms of returns. Since 1833 the market has been positive only 46.7% of the time during the first year of a new presidential cycle. Furthermore, returns have been low with the Dow only gaining 1.91% on average.
As you can see in the table below the post-election years have been positive 21 out of 45 times. However, the average return of those 21 positively biased years has been 19.1% which is skewed, again, by the 66% return in 1933. Conversely, the market has been negative 24 times with an average loss of -13.1%.
Focusing On Risk Management
If we average out the probabilities between the decennial and Presidential election cycles we find that we are facing a 60.5% chance of a negative return year with an average loss of -12.5%. Of course, we are not in a normal economic cycle by any means. With the Federal Reserve pumping billion a month into the financial system, along with Japan, China and Europe, the markets could very well defy the odds.
For investors, all of these statistical studies and comparisons do little to offset the risks of investing. While the media focuses on presenting the optimistic case for a continued bull market - the risks of loss are all too real. However, therein lies the problem with the constant need for investors to compare their performance.
Tom Dorsey once wrote;
“Comparison is the cause of more unhappiness in the world than anything else. Perhaps it is inevitable that human beings as social animals have an urge to compare themselves with one another. Maybe it is just because we are all terminally insecure in some cosmic sense. Social comparison comes in many different guises. ‘Keeping up with the Joneses,’ is one well-known way.
Comparison-created unhappiness and insecurity is pervasive, judging from the amount of spam touting various enlargement procedures for males and females. The basic principle seems to be that whatever we have is enough, until we see someone else who has more. Whatever the reason, comparison in financial markets can lead to remarkably bad decisions.
Comparison in the financial arena is the main reason clients have trouble patiently sitting on their hands, letting whatever process they are comfortable with work for them. They get waylaid by some comparison along the way and lose their focus. If you tell a client that they made 12% on their account, they are very pleased. If you subsequently inform them that “everyone else” made 14%, you have made them upset. The whole financial services industry, as it is constructed now, is predicated on making people upset so they will move their money around in a frenzy. Money in motion creates fees and commissions. The creation of more and more benchmarks and style boxes is nothing more than the creation of more things to COMPARE to, allowing clients to stay in a perpetual state of outrage.”
This is why we manage portfolios from a risk managed approach – greater returns are generated from the management of “risks” rather than the attempt to create returns. Our philosophy was well defined by Robert Rubin, former Secretary of the Treasury, when he said;
“As I think back over the years, I have been guided by four principles for decision making. First, the only certainty is that there is no certainty. Second, every decision, as a consequence, is a matter of weighing probabilities. Third, despite uncertainty we must decide and we must act. And lastly, we need to judge decisions not only on the results, but on how they were made.
Most people are in denial about uncertainty. They assume they're lucky, and that the unpredictable can be reliably forecast. This keeps business brisk for palm readers, psychics, and stockbrokers, but it's a terrible way to deal with uncertainty. If there are no absolutes, then all decisions become matters of judging the probability of different outcomes, and the costs and benefits of each. Then, on that basis, you can make a good decision.”
It should be obvious that an honest assessment of uncertainty leads to better decisions, but the benefits of Rubin's approach, and ours, go beyond that. For starters, although it may seem contradictory, embracing uncertainty reduces risk while denial increases it. Another benefit of acknowledged uncertainty is it keeps you honest.
“A healthy respect for uncertainty and focus on probability drives you never to be satisfied with your conclusions. It keeps you moving forward to seek out more information, to question conventional thinking and to continually refine your judgments and understanding that difference between certainty and likelihood can make all the difference.”
The reality is that we can't control outcomes; the most we can do is influence the probability of certain outcomes which is why the day to day management of risks and investing based on probabilities, rather than possibilities, is important not only to capital preservation but to investment success over time.
Regardless, whether you "buy in" to all of the various statistical studies, or not, is hugely irrelavent. Investors will lose the most money during the middle of the year by "panic selling" as markets can, and do, vasicllate widely. While it is indeed possible that 2013 could turn out to be the 5th positive year in a row for the markets - my suspicion it could be a fairly bumpy ride along the way.
Source: Street Talk Live


