


Kleptocracy is a word from Ancient Greek that means “thief” and “rule” or rule by thieves. Kleptocrats seek to create systemic schemes that take advantage of governmental corruption to extend the personal wealth and political power of government officials and the ruling class. They may do it through either the real or de facto looting of state funds at the expense of the public and often without even the pretense of honest service for the public good. For a look at kleptocratic agents in action, watch the documentary film “Inside Job.” I believe we elected not one but two kleptocratic administrations and legislatures back to back, first Bush then Obama.
The concept of kleptocracy illustrates the real story about the U.S. fiscal issue. It is clear that corporate taxes as a percentage of GDP has fallen far below 1 percent. Looking at the Treasury’s Daily Statement for Jan. 1 to April 19, the total corporate tax payments to the Treasury year over year were $66 billion versus $88 billion. These weak numbers are occurring in what is purported to be an economic recovery. Much of the cyclical recovery in earnings is related to what is almost a corporate-tax payment holiday, mostly for larger firms.
CHART ONE

Have low corporate taxes resulted in more jobs? No. Despite mantra-like claims it someday will, to date there is no correlation whatsoever between tax breaks for the corporate sector and job creation. The same would apply to other metrics of American poverty and distress, such as food stamp recipients (Chart Two).
CHART TWO

Taxes on employment income — one of the most important sources of government revenue — are not sufficient to support the system given that the level of total employment is a mere 45.3 percent, the lowest since 1983. In fact, a large and ever increasing portion of the population depends on government transfer payments for survival.
Chart Three shows personal income excluding government transfers (the blue, dotted line) has barely budged. Furthermore, the trust that collects and dispenses Social Security benefits is also in a gradual draw-down mode. This peaked on Jan. 25 at .645 trillion, and has fallen .4 billion as of April 18 to .629.6 trillion. Back in December, the CBO projected that trust fund balances would increase by9 billion in FY2011. Simply put, this trust already has more receivers than contributors, which makes the system a drain on government cash flows.
Personal income dependent on government transfer payments (red line) has been the name of the game for the consumer throughout this “recovery.” Corporations, plutocrats and rent seekers gather up the profits on this government largess and then are largely exempted from actually participating in funding the Government. Little wonder there has been a “profit-driven” bull market.
CHART THREE

A money printing induced, casino-based financial economy — otherwise dubiously known as “the wealth effect” — combined with low taxes on capital has concentrated American wealth into the hands of the richest 1 percent. Seven percent of income flows to the top 0.1 percent. Meanwhile, tax receipts in general are the lowest as a percentage of GDP in a half century.
CHART FOUR

The Congressional Budget Office is hoping for a substantial increase in tax revenues this year and next. Future tax-revenue projections are hugely optimistic; but when one actually looks at the Daily Treasury Statement of late, there is no sign of it whatsoever. From Jan. 1 to April 19, total taxes collected per the Daily Treasury Statement was 1 billion versus 0 billion. Almost seven months into the 2011 FY, total taxes collected is . 197 trillion. The 4th calender quarter of 2010 was holding up, but the extension of and additions to the Bush tax cut program have stymied that. With many analysts once again lowering GDP estimates, the trend is weakening further. Certainly, credit agencies are eying this data closely.
CHART FIVE
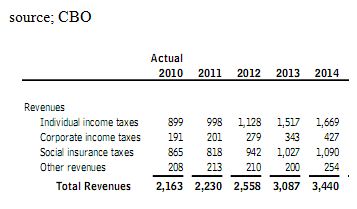
CHART SIX (SHOW ME THE MONEY!)

Notice that budget projections for FY2011 and FY2012, are based on healthy tax-receipt projections that is now failing to make its appearance. Even so, it still called for record outlays of 26 percent of GDP and record-low receipts of 14 percent of GDP (chart 7). So far I have just been addressing budgetary matters. This doesn’t even include all the liabilities from federal guarantees, interventions, backstops, inflationary fallout and Dollar debasement in effect since the 2008 financial crisis.
When questioned about the Fed’s .7 trillion portfolio, much of which was taken off the hands of financial institutions, Ben Bernanke simply said, “It’s all very complicated.” It is really not so complicated. Illustrating the all-roads-lead-to-the-Treasury circularity, the Fed holds 4 billion in mortgage backed securities, presumably backed by government-sponsored entities, like Fannie Mae and Freddie Mac. They in turn are backed by the U.S. Treasury. Elsewhere, the FDIC is insuring .2 trillion in bank deposits with a negative .4 billion fund balance and receives its deficiencies from (you guessed it) the U.S. Treasury. The states have so far borrowed .4 billion, from the Treasury to fund unemployment trust deficiencies.
This financial crisis has now been replaced with an impending government fiscal crisis. A large portion of the budgetary and government-intervention loot goes to kleptocractic institutions, crony capitalists and their fellow travelers. They toss enough crumbs to the rest of the population to keep them distracted from the serious looting. All very profitable until there is a true fiscal crisis.
To put it into perspective: Average tax receipts over the last half century are about 17 percent and spending about 20 percent. Any reasonable plan would attempt to return to those norms. The partisan budget approach focuses on central themes. From the political right, a major cut in government spending without tax increases would, by some miracle, increase tax receipts. It’s interesting because taxes actually collected relative to GDP are already at historic lows. From the left, there’s a call for higher taxes and few spending cuts in order to maintain the status quo. The cause of the impasse in governance should be apparent to any thinking person: Kleptocrats control the process and put forth endless straw men that keep them feeding at the trough of the U.S., the biggest Banana Republic on the planet.
CHART SEVEN

For the investor, it’s a question of fiscal performance. Little else matters. It’s effectively what Standard & Poor is warning about. A rating agency’s job is not to govern. We have a kleptocrat-controlled “leadership” for that. The administration claims Standard & Poor made a political judgement. Perhaps, but who could blame them? At any rate, fiscal performance measures, such as tax receipts, can be tracked without mystery and in a totally dispatched, nonpartisan manner via the CBO or the Daily Treasury Statement. I do this at my Actionable site. When it comes to this sort of rhetoric, I become a Missourian. Show me the money.
Even with ultra low interest rates, interest expense is 0 billion this year or 3 percent of GDP. If government borrowing rates were to rise a mere 2 percent, interest expense would surge to 0 billion annually or over 5 percent of GDP. That would make the task of bringing down outlays relative to GDP nearly impossible without draconian cuts.
At this stage, if any serious effort is made to narrow or correct the extremes in both outlays and receipts, many if not all sectors will be impacted. There will be a large drop in corporate profits and the faux financial markets will fizzle, if not crash. Fail to act decisively and the U.S. is well on a trajectory to hit 110 percent Treasury debt to GDP (versus 95% now) sometime in the September (FY2012) with stresses and crisis every step of the way.
This post is reprinted from Russ's premium service, Russ Winter's Actionable. Click here to subscribe to Russ Winter's Actionable, and get instant access.


