The following is an excerpt from the June 21, 2013 blog for Decision Point subscribers.
After the October 2012 top, gold has been in decline for nearly nine months, and this week it dropped to another low that has the radio/TV gold hucksters changing their tune from "buy gold because it's going higher" to "look how cheap gold is, buy on the dip". While it may be tempting to try to pick a bottom, we have observed that it is usually a suckers play. That, however, doesn't stop us from checking the charts to see where we might expect a bottom to form.
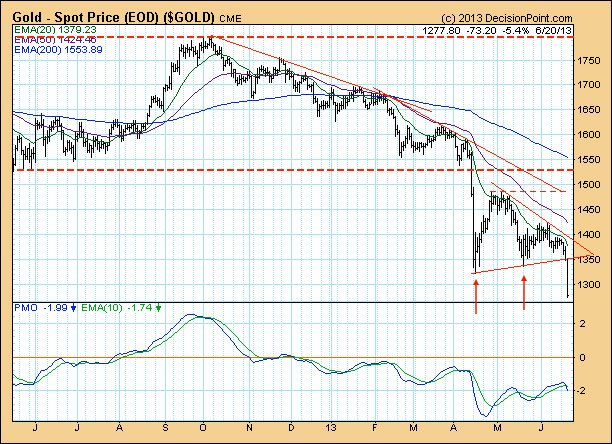
The daily bar chart shows two previous support areas that looked promising. First was the bottom of the trading range at about 1530. That support had held three times since October 2011. When it failed in April, the technical picture changed from bullish to bearish. Next was a double bottom that formed in April and May, but instead of moving up smartly off the May bottom, the rally fizzled and price rolled over, decisively breaking the double bottom support line on Thursday.
We didn't hold much hope that the double bottom would have a bullish resolution because the picture was so negative. Major support was broken in April, and the moving averages are in a negative stack -- price is below the 20-EMA, which is below the 50-EMA, which is below the 200-EMA. It is not impossible for a bottom to form, but this is not an environment were we would go hunting for it.
On the weekly chart the best looking area of support is just above 1000. We picked that because there is a lot of congestion on the left side of the chart that show it as a previous level of resistance and support.
Conclusion: Gold is in a bear market, so we don't expect bullish outcomes. Bottom-pick at your own risk. An important bottom may arrive at any time, but for now the best support level appears to be around 1000.
Technical analysis is a windsock, not a crystal ball.


