There are two economies--the real one, which is in decline, and the "let's pretend" one touted by the State and corporate propaganda machines.
Children love to play "let's pretend." Let's pretend the economy is "recovering."Why does this "recovery" remind me of an addict who's conning his caseworker? (Yes, I'm really in recovery--those aren't tracks, they're insect bites....)
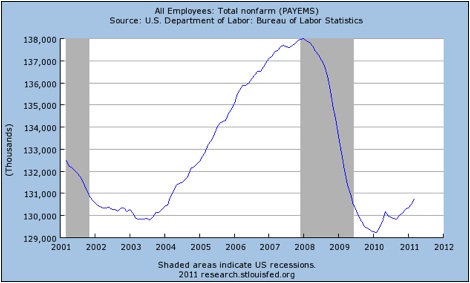
Let's play pretend that jobs are really really coming back, so please ignore this chart, or turn it upside down:
Also ignore that Big U.S. Firms Are Shifting Hiring Abroad.
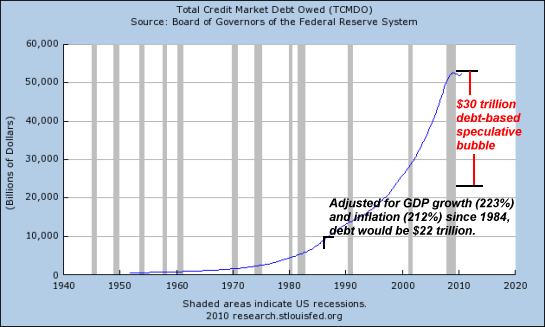
Let's pretend that households, corporations and government are reducing their debt. To do that, we have to ignore that the debt-junkie (i.e. the U.S.A.) hasn't kicked the monkey off its back, it just keeps feeding it more debt. David Stockman dismantled all that propaganda about corporations sitting on trillions in cash--they're sitting on even bigger piles of debt: Federal Reserve’s path of destruction. He also takes out the claim that "consumers are deleveraging." Consumer debt has barely budged.
Never mind, let's pretend we're deleveraging. So please ignore this chart:
Excuse me but that cute little debt monkey on your back is actually an 800-pound gorilla.
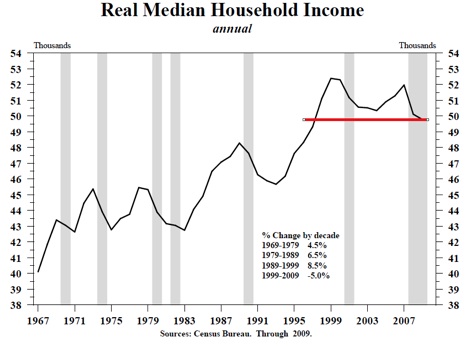
Let's pretend that wages are rising. Except they aren't--household income is getting creamed. Real wages are back to the pre-dot-com bubble days of 1996--only the debt load on households and the nation have skyrocketed since then.
Courtesy of the always insightful Oil Empire and Peak Oil, here is a chart of the ratio of wages to gasoline:
Put another way: this is your wage priced in gasoline. Notice how wages tanked when oil hit 0/barrel in the summer of 2008, and how the brief plunge in oil around Q1 2009 caused a spike in the ratio. Now that the Fed is destroying the U.S. dollar, then oil is back over 0 and well on its way to 0 and higher.
Let's pretend your purchasing power isn't in a free-fall. Have you eaten an iPad recently? Yum, crunchy!
Let's pretend unemployment is falling. The only way to make losing 7 million jobs look good is to ignore this chart of the ratio of civilian employment to population. The ratio is back to the 1970 level, back before Mom, Sis and Aunty all went to work. This means there are fewer people working to support the population. Fewer workers means higher taxes on those still standing, and higher debt loads on them, too, as they have to service household debt, student loans, underwater mortgages and a Federal debt that's exploded higher by trillion a year just since the "end of the recession."
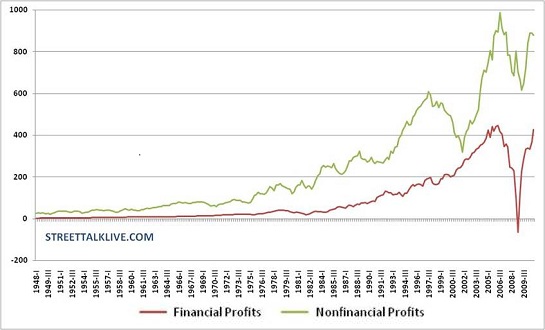
Let's pretend corporate profits are the most important metric of our financial well-being.
Who benefits from the surge of corporate profits to record levels around .6 trillion, or 11% of GDP? The 21 million employees of global Corporate America certainly do, but then they represent about 16% of non-farm employment, roughly in line with government employment (22 million).
Too bad Global Corporate America is hiring where the growth is faster and the wages lower, i.e. overseas (Big U.S. Firms Are Shifting Hiring Abroad).
Let's pretend those great profits trickle down to the greater good. Only they don't. Corporate taxes (around 0 billion annually) cover less than 10% of Federal expenditures (Federal Budget 2009) and despite those record profits--surprise, Corporate Tax Receipts Plunge 31% in Q1.
The tax avoidance Panzer divisions of Global Corporate America are simply unstoppable forces of Nature, it seems. Corporate welfare queens never had it so good.
But let's pretend those profits increase the wealth of a broad spectrum of citizens.Oops, the top 5% of households collect 72% of the corporate profits.
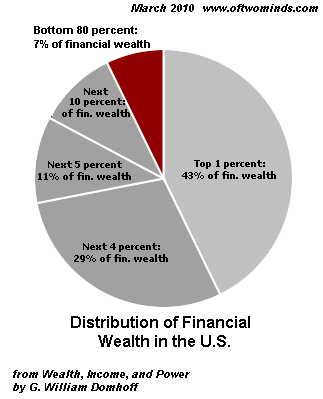
In Who Rules America?, Sociologist G. William Domhoff draws an important distinction between the net worth held by households in "marketable assets" such as homes and vehicles and "financial wealth." Homes and other tangible assets are, in Domhoff's words, "not as readily converted into cash and are more valuable to their owners for use purposes than they are for resale."
Financial wealth such as stocks, bonds and other securities are liquid and therefore easily converted to cash; these assets are what Domhoff describes as "non-home wealth" on his website Wealth, Income, and Power.
As of 2007, the bottom 80% of American households held a mere 7% of these financial assets, while the top 1% held 42.7% and the top 20% held fully 93%.
Never mind that, let's pretend the corporate profits trickle down via the "wealth effect" to pension funds that benefit workers everywhere. Too bad that according to the Fed flow of funds data, this rousing, raging Bull Market in stocks fueled by stupendous corporate profits has only brought total pension fund assets back to their 2007 level: .3 trillion in 2007 and .1 trillion in 2011.
Adjusted for inflation (as measured by the Bureau of Labor Statistics), the pension assets would have to be over .3 trillion just to stay even with their value in 2007. So pension funds have actually declined by over trillion in real dollars in the Great Bull Wealth Effect.
So the wage earner's pension assets have actually fallen. We got your wealth effect right here, buddy, right next to the "recovery." And the check's in the mail, we promise.
How much longer are we willing to play "let's pretend"? Eventually we'll have to return to the grown-up world and deal with reality.
Readers forum: DailyJava.net.
