Fed Remains Coy
We continue to believe (a) tapering is about bubble management, and (b) the base case is for a September tapering announcement from the Fed. However, the Fed wants to leave the door open to the “what happens if they don’t taper in September” scenario. Why? The Fed wants money managers to stay invested to assist with recreating the wealth effect. If a money manager bets on the “tapering is negative scenario”, they could get caught under-invested or short if the Fed surprises with a “no change” announcement next month.
The Fed’s stance of adjusting QE on the fly based on economic data helps keep uncertainty in the picture and a somewhat constant wind at the stock market’s back.
(Listen to: Brian Pretti: QE Here to Stay in One Form or Another)
A Pulse From China
China’s growth slowed to 7.5% in the second quarter, putting the economy on track for its weakest year since the late 1990s. This is obviously a concern when placed in the context of the global economy. While China has much work to do, economic data released Thursday did show some signs of life. From Reuters:
Imports of crude oil and iron ore rebounded from multi-month lows to record highs last month as more raw materials were shipped in to rebuild depleted stocks, and soy bean purchases hit a record for the second straight month. A steadying of the economy would be a relief to China’s leaders, who have scrambled to shore up growth since mid-year amid concerns a sharp slowdown could derail their attempts to reform the economy so it was driven more by consumption than debt-funded investment and manufacturing. Data from the Customs Administration showed exports rose 5.1 percent in July from a year ago, a smart turnaround from their first fall in 17 months in June. Analysts had expected a 3 percent rise. Imports fared even better with a 10.9 percent jump from a year earlier, more than five times what analysts had forecast. The surprising strength in imports left China with a smaller-than-expected trade surplus of .8 billion.
Fed-Induced Weakness
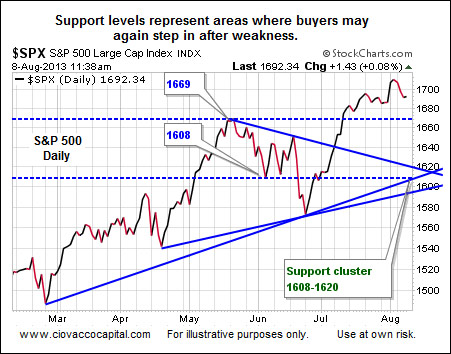
Taking into account the market’s obsession with ongoing money printing from the Fed, investors are justified to monitor the Fed’s actions closely. Despite the recent tapering-induced weakness in stocks, the weekly chart of the S&P 500 below shows a series of higher highs and higher lows, which is the definition of a favorable uptrend.
Housing Showing Improvement
Given the impact on household balance sheets, the value of residential housing remains a key cog in the economic wheel. The lingering question for markets is how does housing perform going forward as the Fed tries to step off the money-printing accelerator. From Bloomberg:
Prices for single-family homes climbed in 87 percent of U.S. cities in the second quarter as the national housing recovery accelerated amid competition for a limited number of properties on the market. The median transaction price rose from a year earlier in 142 of 163 metropolitan areas measured, the National Association of Realtors said in a report today. A year earlier, 75 percent of regions had gains.
When balance sheets improve, it helps spending. Increased spending creates economic activity. As the economy improves, personal finances improve, which makes it easier to pay the mortgage on time. From Bloomberg:
The share of U.S. mortgages that are seriously delinquent plunged to the lowest level in almost five years as improving employment and rising home prices move the foreclosure crisis closer to an end. The percentage of home loans that were more than 90 days behind or in the foreclosure process fell to 5.88 percent in the second quarter from 7.31 percent a year earlier, the Mortgage Bankers Association said in a report today. That was the lowest since the third quarter of 2008, when it was 5.17 percent. “It’s a dramatic improvement over last year,” said Jay Brinkmann, the Mortgage Bankers Association’s chief economist, said in a telephone interview today from Washington. “It’s not back to where we should be. It’s not back to where we were. But it’s a major decline.”
(Hear more: Rick Sharga: We Are Nowhere Near a Real Estate Bubble)
Investment Implications
Thursday’s economic data from China and U.S. continue to point away from an imminent bear market inducing recession. From a technical perspective, our market model has thus far classified the recent gyrations in stocks as “volatility to ignore”. Therefore, we have made very few changes over the past several weeks, holding our broad market (SPY) and sector positions in technology (QQQ), financials (XLF), mid-caps (MDY), and small caps (IWM). If we see improvement in emerging markets (EEM) and inflation protection assets, such as materials (XLB), we may look to diversify by adding a better risk-reward horse to the stable.
If the markets continue to struggle, the chart above identifies the following S&P 500 levels as relevant for bulls and bears: 1669, 1620, and 1608.
Source: Ciovacco Capital


