


Overview:
- Long-term momentum of the stock market is bearish which could spell trouble
- Review of the credit markets does not reveal elevated risk levels associated with bear markets
- Weight-of-the-evidence approach suggests a market pause, not a top
Back in a January 12th article (click for link) I mentioned that I rely on two primary indicators to determine the primary trend of the market, whether bullish or bearish. Those two indicators are the monthly MACD signal and the slope of the 200-day moving average (200d MA) on the S&P 500. We’ve been on a monthly MACD sell signal for the S&P 500 ever since March however the 200d MA for the S&P 500 continues to climb higher, which equates to a neutral market picture. The question is, are we now forming a major top or pausing before resuming higher?
When the outlook appears cloudy, a weight-of-the-evidence approach is usually best. In that light, the first place to examine is the credit markets, which often give an early warning of coming trouble. So, let's take a look.
One of the credit markets that typically shows elevated stress levels during a crisis is the money market and a look at past crises over the last two decades bears this out. When viewing the current level of the three money market spreads below, we do not see anything close to the level of stress associated with the two prior major tops in the market.

Source: Bloomberg
Looking at the U.S. corporate credit market also shows little signs of stress. This is seen when looking at credit default swaps (CDS) for the investment grade (IG) and high yield (HY, AKA: “Junk bond”) markets below. We can see that while CDS spreads for the IG and HY markets are off their best levels seen in the middle of 2014, they are nowhere close to the same level of distress seen in 2011 and 2012 and aren’t sending any warning signs at the present time.
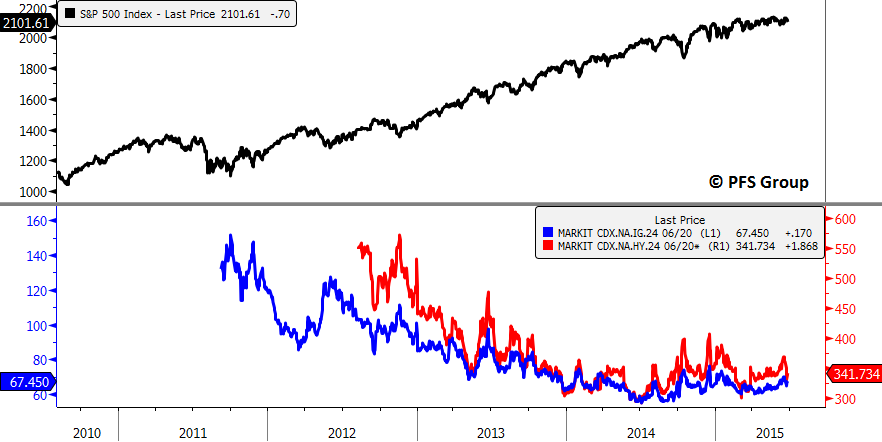
Source: Bloomberg
Lastly, one of my favorite credit measures is the Bloomberg U.S. Financial Conditions Index (FCI), which is a composite of credit spreads consisting of the money market, bond market, and equity markets. (Note: The FCI is normalized with zero, the dotted horizontal line, representing normal levels of financial stress, above zero representing low levels of stress, and negative numbers representing elevated levels of market stress. When viewing the FCI below we can see that it dipped into negative territory during the early 1990s recession as well as in the late 1990s when we had the Asian Currency Crisis, Russian default, and LTCM crisis. The index largely stayed in negative territory until 2003 when the U.S. equity bull market resumed after the technology bubble burst. The Index remained positive until July 2007 when it feel deep into negative territory and never looked back until the recession ended in 2009. We saw dips into negative territory in 2010 and 2011 during the Greek and US debt crisis but have been in positive territory ever since September 2012. Given that we still remain in positive territory, we do not see any ominous warning signs coming from the U.S. credit markets.

Source: Bloomberg
Stepping back and taking a more global view, currently the world’s main focus is on Greece. A quick update on where things stand is given below from a Bloomberg article.
Greece Pressured to Bow to Deal at Meeting Touted as Decisive
Greece heads into a decisive round of talks with European finance ministers with little wriggle room to extract concessions from creditors who presented a last-ditch package to free up aid the country desperately needs.
Going into the 2 p.m. Saturday meeting in Brussels, the Greek position was that the offer was unacceptable. While German Chancellor Angela Merkel touted the five-month bailout extension as “very generous,” Prime Minister Alexis Tsipras compared its terms to an “ultimatum” and “blackmail.”
The Greek leader — with a mandate to end austerity, yet keep the country in the euro — faces a hard choice. A proposal by creditors to unlock as much as 15.5 billion euros (.3 billion) and extend Greece’s program through November does not include the debt relief he’s adamant about and still demands cuts that are anathema to many lawmakers back home.
As nerves fray after months of brinkmanship, the pressure is on for a weekend deal. Failure to get one by the time markets open puts at risk a payment due June 30 to the International Monetary Fund and raises the specter of capital controls. Parties have to chip away at their differences or prepare for worst-case scenarios to contain the fallout.
Looking at CDS on European sovereign debt shows that the level of risk priced into the credit markets in Europe is well off the levels seen at the peak of the crisis in 2010 and 2011 and suggests that the situation with Greece does not present the same level of systemic risk as it did several years ago. For more background on this subject and current negotiations between Greece and its creditors, please see our latest update with Frances Coppola (link).
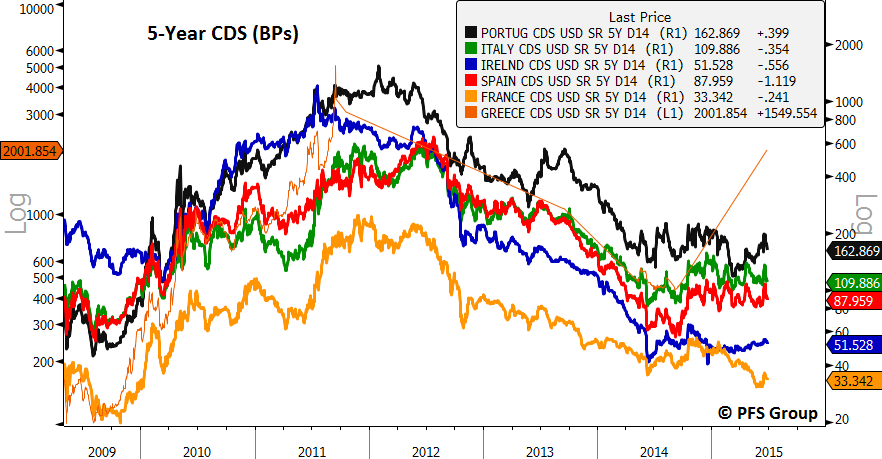
Source: Bloomberg
Confirming the message from the European credit markets is the BofA Merrill Lynch IRisk Index, which not only remains below zero but is well below the readings seen in 2010 or 2011. This index was largely negative during the 2000-2003 bear market, went positive in mid to late 2007 as the global financial crisis was heating up, and remained positive until late 2012. We did have a brief spike with the taper tantrum in 2013. As long as we remain near the zero level the U.S. equity market should remain in good shape but given the fact we are at or below zero means there are no major warning signs coming from the global credit markets.

Source: Bloomberg
Summary:
Given the technical picture of the market’s primary trend is questionable (where momentum has turned negative but the trend remains bullish) it can be helpful to look at clues from other markets to determine if the stock market is putting in a bull market top or merely consolidating. One of my preferred markets to analyze for insights into the market’s health is the message from the credit markets, which often lead the stock market.
The quick survey of various credit markets above suggests that there aren’t any major warning signs of an impending bull market top. This suggests the market is bidding its time before moving higher which isn’t a bad thing given the strong move seen since 2012 as the market takes a much needed pause. In subsequent articles I will take a look at other indicators that are useful to gauge whether the market is peaking or taking a pause but the bulls should be encouraged for now that they have the credit markets on their side.


