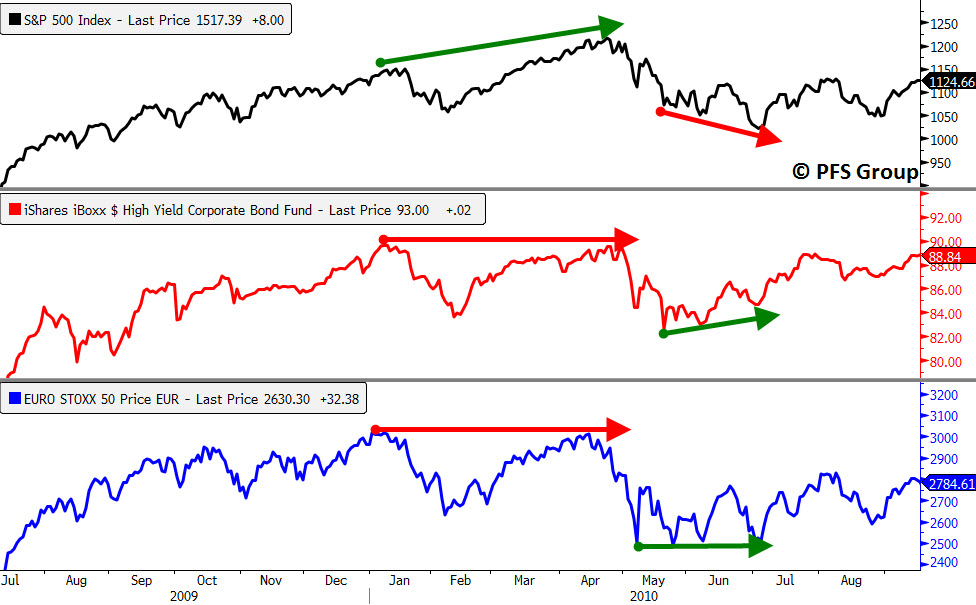
Two indicators are currently suggesting caution towards the market’s short-term outlook. Caution is certainly reasonable given how overbought the markets are, though an overbought market can stay overbought and continue on longer than expected. That said, certain canaries in the coal mine are beginning to sing that a short-term pullback may be just around the corner.
Intermediate Market Peaks Often Identified by Junk Bonds and European Equities
We have seen several intermediate market peaks over the last few years and most of them have been associated with negative divergence with junk bond funds and European equities that warned of a coming top.
The 2010 mid-year top and bottom are a great example of this where leading into the April/May top both the iShares High Yield Bond Fund (HYG) and the Euro Stoxx 50 Index failed to make a higher high above the January peak leading to a negative divergence prior to the market correction. As the market correction commenced the Stoxx 50 bottomed in early May while HYG bottomed in the middle of May while the S&P 500 didn’t bottom until July as both produced a bullish divergence suggesting a bottom was forming.
During the multi-month topping process in 2011, the Stoxx 50 Index gave ample warning of a coming top as it peaked in February and made a series of lower highs while HYG followed the S&P 500 more or less and didn’t provide a clear warning leading into the peak, though it did accelerate lower from May to July than the S&P 500 did. Not only was the Stoxx the better early warning indicator for the 2011 top but also the bottom as it troughed in the middle of September while both the S&P 500 and HYG didn’t bottom until two months later in November.
The HYG bond fund acted as a better early warning indicator in 2012 than it did in 2011 as both HYG and the Stoxx 50 Index showed negative divergences at each intermediate top during the year. The first significant top of 2012 came when the S&P 500 peaked near 1420 in early April, though the HYG fund peaked well before it in late February while the Stoxx 50 peaked a few weeks earlier in March. We witnessed another top in October and HYG showed the most negative divergence with the S&P 500 while the Stoxx 50 more or less traded in step with the S&P 500.
Between the two indicators, at least one of them has shown significant negative divergence with the &P 500 near intermediate tops and as seen below in the shaded red box in the far right of the chart, both are currently selling off while the S&P 500 is hitting new highs suggesting a near-term pullback may be just around the corner.
Given how strong the market’s internals are (please see Wednesday’s article) I would expect any pullback to be shallow in nature and likely see the S&P 500 pullback to the breakout point near its September 2012 highs near 1465-1475 for roughly a 3-5% pullback. After working off an overbought condition and bullish sentiment, the markets could hit new highs and continue their advance until we see more significant internal erosion in the market’s health.


