Summary:
- Small cap stocks have underperformed large cap stocks by nearly 10% this year
- Junk bonds are also underperforming investment grade bonds
- Contracting margin debt associated with weakness in riskier areas of the market
- Coming end of QE and first Fed rate hiking coming into view calls for investor caution ahead
There has been a clear preference this year for large cap stocks over small cap. This is readily visible when looking at performance this year of the Russell indices. Here we see mega cap stocks like the Russell Top 50 Index are up just under 5% year-to-date (YTD), while microcap stocks such as the Russell Microcap Index are down nearly 5% this year and the Russell 2000 small cap index is down more than 3%.
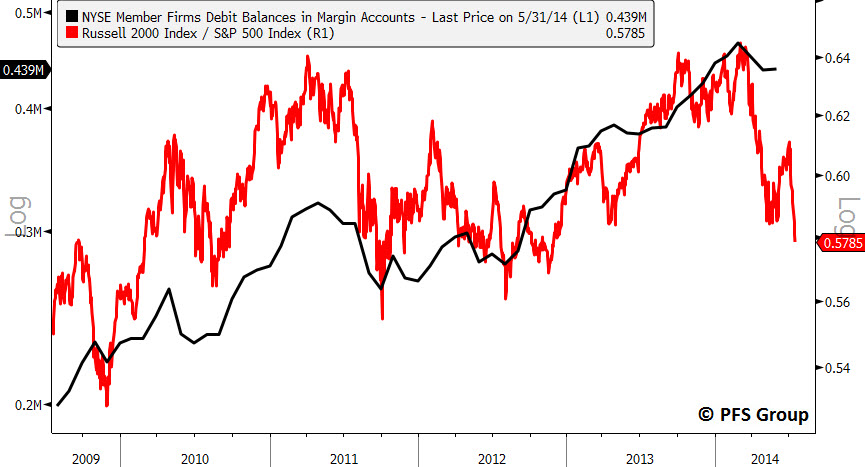
Small cap stock performance is a good indication of market liquidity as the riskier areas of the market perform best when there is ample liquidity and weakest when liquidity is thin. For this reason it comes as no surprise that the relative performance of the small cap Russell 2000 index to the large cap S&P 500 Index closely tracks margin debt levels. The recent weakness in small caps suggests that margin debt is likely to contract further in the coming weeks.
Another sign that points to a potential liquidity air pocket coming in the markets is the underperformance of junk bonds relative to investment grade bonds which typically tracks margin debt levels. Since the start of the year junk bonds have been underperforming investment grade bonds and have given back half of their outperformance seen in 2013.
The preference for large cap over small cap and for investment grade bonds over junk bonds is readily visible in fund flows. The iShares Russell 1000 ETF (IWB) has seen nearly 5M in inflows this year while the iShares Russell 2000 ETF (IWM) has seen over B in outflows. Similarly, the iShares Investment Grade Bond ETF (LQD) has seen nearly B in inflows while the iShares High Yield Bond ETF (HYG) has witnessed over .5B in outflows.
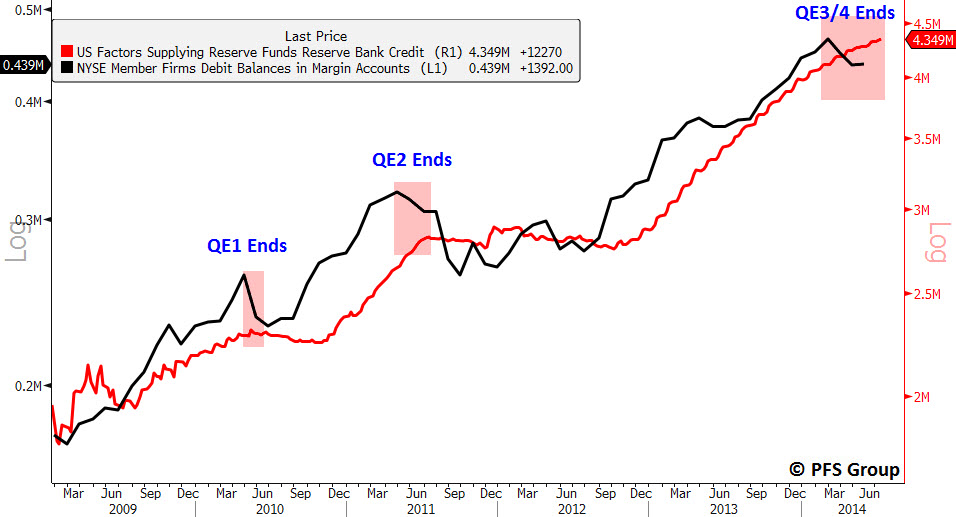
The underperformance in small cap stocks and junk bonds, which is coincident with the peak in margin debt, may be the early manifestations of investors beginning to price in a less liquid financial market as QE by the Federal Reserve is coming to an end in the fall. Prior to the conclusion of both QE 1 and QE 2 we saw margin debt peak and the same reaction in small cap and junk bond underperformance. However, when the Fed signaled another round of QE, margin debt expanded and animal spirits were reignited with flows moving back into the riskier areas of the market. The link between margin debt and the Fed’s balance sheet is shown below and given the Fed is slated to cease expanding its balance sheet this fall we may continue to see months of weakness in small cap stocks and junk bonds.
Summary
The recent weakness in small cap stocks and junk bonds appears to be stemming from investors preparing for a financial environment with less liquidity as the Fed is slated to end its current program of QE by October.
This fall could be setting up to produce the first market correction (10%+ decline) seen since the middle of 2012 as investors contend with a less accommodative Fed. Not only will the market have to grapple with the end of QE but also the likelihood of the first eventual Fed rate hike in early 2015. As I argued in my last article, the jobs market is providing a clear signal that the Fed should be raising interest rates soon, which has historically produced a 10% selloff as an initial response (see data).
Given the end of QE and the likelihood of the first Fed rate hike coming closer into view, investors may want to start placing a greater emphasis on risk management in the back half of this year.


