


One of the developments that caused me to take a defensive view earlier in the year and recommend shunning the high beta cyclical sectors in favor of defensive sectors like telecommunication and utilities ("Contrary Investing," and "The Dual-Edged Sword of Investing: Risk Vs. Reward") was a sharp deceleration in the leading economic indicators (LEI) which peaked late in 2009. The decline from the peak in the LEI signaled a growth deceleration over the strong pace seen in 2009, but as 2010 wore on the LEI fell even further and turned negative which increased the likelihood of a recession in the future, and why I became cautious earlier in the year. Just as following the LEIs allowed investors to sidestep much of the summer correction and benefit from it by shifting their portfolios towards defensive sectors, investors may consider reversing the safety trade in favor of cyclical sectors and stocks in general over fixed income as the LEI has bottomed and is now turning up. An increase in the growth rate of the LEI suggests increasing exposure to stocks in general and to shun bonds, and in particular reflationary assets and cyclical sectors should perform well in the months ahead.
The relationship between the LEI and stocks can be seen below when viewing the Economic Cycle Research Institute’s (ECRI) Weekly Leading Index (WLI). For a quick historical review, the WLI peaked late in 2003 and heralded a market correction that occurred in 2004, but its bottoming and return to a positive growth rate late in 2004 signaled the bull market that began in 2003 was still intact and stocks soon advanced for another two years without a sizable correction. However, in 2007 the WLI diverged with the S&P 500 and turned negative well before the stock market rolled over and correctly signaled a recession well before economists or financial talking heads would even mention the "R" word. Likewise, when everyone felt the world would end in early 2009 the WLI had already bottomed late in 2008 and was slowly marching upwards and correctly predicted an economic and stock market recovery. Finally, just as the late peak in 2003 warned of the 2004 correction/consolidation, the WLI peaked late in 2009 and warned of a coming correction well before the markets peaked in April of this year.
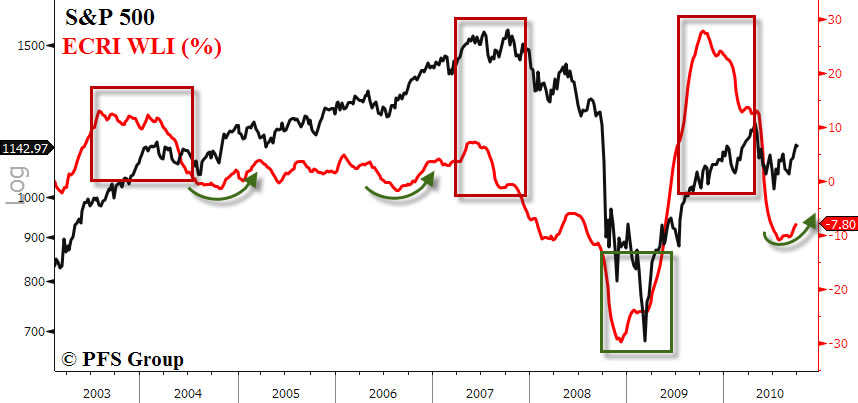
Source: ECRI, Standard & Poor’s
It has paid to pay attention to the WLI and that is what I am doing. Monetary growth figures are picking up, interest rates have fallen, and both of these financial developments are bullish for the economy and financial assets, which is what the WLI is likely discounting. Coinciding with a turn in the WLI is a bottom in the S&P 500 as the two are now moving in harmony, which gives more conviction that we will have a year end rally. In addition to the trough in the ECRI WLI, the ECRI’s Future Inflation Gauge (FIG) is also bottoming, signaling the deflationary fears so prevalent earlier in the year are receding, which favors overweighting stocks versus bonds. This trend can be seen below in which the ECRI FIG (black line) tracks the general trend in the stock to bond ratio. The stock to bond ratio rises when inflationary pressures increase, signaling bonds are underperforming stocks. The ratio falls when deflation is gaining the upper hand when the FIG is falling. Because the FIG is now bottoming I expect the strong outperformance of bonds over stocks to end as stocks are likely to outperform bonds as concerns now shift towards inflation rather than deflation.

Source: ECRI, Standard & Poor’s, Bloomberg
The market internals have clearly improved since bottoming in July, and much of it is likely due to anticipated further easing by the Fed. Reading recent Fed comments illustrates that the Fed has voiced inflation is too low and they are bent on reflating the financial system and economy. Stocks discount future events and the bullish action of the markets is discounting future Fed reflation.
That said the market is presently overbought on a short term basis and I expect the market to grind higher after a short term correction. There is an inherent "Bernanke Put" on the market so I would expect any weakness to be bought in expectation of Fed action. So Bernanke is basically keeping a floor on the market and potentially raises the ceiling with additional quantitative easing, and on top of that the markets and global economy have another potential catalyst going for them, and that’s a reacceleration of the Chinese economy.
Watch China Closely
Back in July I recommended to "Keep an Eye on the Shanghai" as the Chinese stock market was in a bear market since peaking last summer, and a potential bottom would have major implications for global economic growth and commodities in particular. The negative trend between the relative strength of the Shanghai Index and the S&P 500 has been broken as the Shanghai is beginning to outperform again.

Source: StockCharts.com
The relative underperformance or outperformance of the Shanghai versus the S&P 500 roughly coincides with the money supply growth rate in China, and so the first uptick in the M2 money supply growth rate gives greater support that Chinese stocks have bottomed. I’m watching for the spill over of increased money supply seen in M2 to be confirmed by the Chinese leading economic indicator (LEI) and the relationship between Chinese cyclical versus non-cyclical sectors.
The Chinese Triple Play

Source: Bloomberg
An uptick in the trend of these two other areas would give confirmation that the Chinese economy is reaccelerating once more which should provide a lift to commodities as China is the world’s marginal buyer and Chinese economic growth and its stock market area leading indicator of commodity prices. Once Chinese equities peaked in 2007 commodity prices had a tough going and corrected a year later. The trough in Chinese stocks in late 2008 signaled the commodity bottom and their peak in 2009 gave an early warning about a commodity correction and consolidation. The recent strength in Chinese equities and trough in China’s M2 money supply also likely indicates a commodity bottom, and taking into account a weak USD the global reflation trade that has been heating up may get a little hotter in the months ahead.

Source: Bloomberg
Turning back to the opening subject of this article, a trough in the ECRI WLI, there is still a few points to make. While the ECRI WLI bottomed late in 2008, the market didn’t bottom until early 2009, though what did bottom coincidently with the ECRI was the relative performance of the technology, consumer discretionary, and basic materials sector.
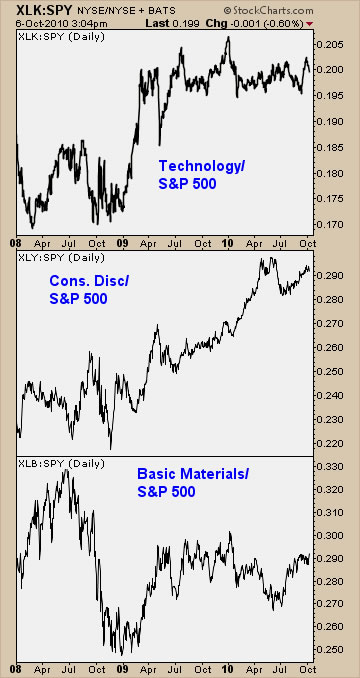
Source: StockCharts.com
At any rate, investors should keep an eye on the cyclical sectors relative performance because further strengthening by the ECRI WLI will likely translate into further outperformance of the cyclical sectors against the S&P 500. Much of this strength is likely discounting future Fed easing, which makes one wonder if the proverbial "Buy the rumor sell the news" is in play and if so, will QE 2.0 have a dramatic affect on the markets?


