


Summary
- Analysis of fund flows has helped identify market bottoms this year
- Flows from junk bonds and small cap stocks suggest another bottom is in
- Measures of breadth also indicative of a market bottom
- With low recession odds and strong lending activity, risk of a bear market is low
ETF Outflows Reach Extremes, Suggestive of a Bottom
A very useful tool for spotting intermediate-term bottoms is to monitor large outflows, or signs of capitulation, in key exchange traded funds (ETFs). To do this, first identify which areas of the market are getting hit the hardest, look at a widely followed ETF for that market, and then watch for fund outflows to hit an extreme to mark capitulation. A case in point is the early February bottom in which the 20-day average of fund flows for the SPDR S&P 500 (SPY) ETF reached the lowest level for the entire bull market. Here's the chart I showed at the time (click for link) where fund outflows correctly signalled the February bottom in the S&P 500:

Source: Bloomberg
Similarly, back in the middle of April I argued we were nearing the end of the pullback in the markets when viewing the technology-heavy PowerShares QQQ Trust (QQQ), which tracks the Nasdaq 100 Index. The 20-day average of fund flows for QQQ reached an extreme level and suggested we had reached selling capitulation in the markets. The extreme selling in QQQ that was highlighted in April is shown below (click for link):

Source: Bloomberg
This go around the selling appears most intense in the small cap equity and junk bond market segments as discussed last month (click here and here). Given these two areas were under the most pressure, I looked at fund flows for both segments and based on the 20-day average of outflows for both I would suggest a bottom is likely in for the markets. As capitulation selling in the SPY and QQQ marked earlier bottoms this year, we’ve clearly seen capitulation in the junk bond market as the 20-day average of outflows from the iShares High Yield Corporate Bond ETF (HYG) reached the worst outflows seen since the bull market began in 2009 as nearly 0M in average daily outflows have taken place in the last 20 days.

Source: Bloomberg
Even greater outflows were seen in the iShares Russell 2000 ETF (IWM), which averaged 2M in daily outflows over the last 20 days. Outflows of this size have marked prior bottoms over the last few years and suggest we’ve seen yet another intermediate-term bottom in the markets (Note: two red arrows did not lead to intermediate market bottoms).

Source: Bloomberg
So Bearish It’s Bullish
Last Thursday I highlighted that breadth had turned so bearish that we were reaching levels associated with market bottoms. For gauging market breadth I analyze the Russell 3000, which makes up roughly 98% of the entire US market capitalization. The percent of members below their short-, intermediate-, and long-term moving averages (2nd panel below) has reached levels associated with prior market bottoms. We’ve also seen a spike in members with 3-month new lows (4th panel below) and one of my favorite indicators, the percent of members with a MACD line above zero (5th panel below), reached the 30% threshold, which has marked solid bottoms over the last few years. All of this suggests the markets have bottomed and what we need to watch now is how strong and robust is the recovery off the lows.

Source: Bloomberg
Buy Signals on Major Indexes
One indicator I’ve come to rely on that has proven to be quite reliable, particularly at bottoms, is the Bloomberg TrendStall indicator that attempts to find changes in trend. When the conditions for a reversal have been met the indicator paints the index purple and when the actual trigger is met a triangle is shown for the signal—a red triangle for a sell signal and a green triangle for a buy signal. Currently, we have the conditions for a reversal (see green circles below) in all of the major indexes but the trigger has not been given yet. As seen below, past buy signals by the TrendStall indicator have proven to be spot on in calling prior bottoms over the last two years and if the buy trigger is given that would be another nail in coffin that the bottom of this pullback is probably in.

Source: Bloomberg
Given Strength of Economy, Recent Pullback Not Indicative of Bull Market Top
With the weakness in the markets this past month, particularly in small cap stocks and the junk bond market, there have been a growing number of bears calling for the end to the present bull market. Given that most bear markets are associated with recessions it is always worthwhile to take a look at the economy and its trajectory before making a bear market call. Doing so shows the risk recession for the US economy in the near future is in the low single digits according to our recession model, which currently calls for only a 3% chance of a recession on the horizon.

Source: Bloomberg
Additional data also suggests near-term recession risks are remote. Today we were treated to the Fed’s Senior Loan Officer Opinion Survey for Q3 2014 and there was a lot of encouraging data to suggest the US economy is still on solid footing. For example, the net percentage of loan officers reporting stronger demand for commercial and industrial (C&I) loans from large and medium firms is near the upper end of the range for the last two decades and not yet showing any deterioration. This is very encouraging as loan demand typically falls off well before the onset of a recession (see red arrows below). If anything, loan demand is currently accelerating (blue arrow).

Source: Bloomberg
Commentary from the Fed’s release is provided below (emphasis added):
The July survey results showed a continued easing of lending standards and terms for many types of loan categories amid a broad-based pickup in loan demand. Domestic banks generally continued to ease their lending standards and various terms for commercial and industrial (C&I) loans...Banks also reported having experienced stronger demand over the past three months, on net, for many more loan categories than on the April survey.
In addition to strengthening C&I loans we also saw the strongest demand for commercial real estate loans since the late 1990s:

Source: Fed
Demand for consumer loans also increased to the highest level since 2005:

Source: Fed
The data from the Fed’s survey shows not only that banks continue to ease standards as liquidity is readily available, but the demand for that liquidity is growing as business and consumer loan demand continues to grow. These are not the conditions you see before a major economic slump.
Summary
Based on capitulation-like selling in both the small cap equity and junk bond segments of the market, it is quite likely that Friday marked a low. While the recent pullback was not fun it also wasn’t the beginning of a bear market as many bearish pundits claimed. The risk of a recession is simply too low and, if anything, the economy continues to build on the momentum coming out of the second quarter as banks, businesses, and consumers show expansion.
While it is probable that Friday marked the low, there clearly has been some damage done to the market’s technical condition and some repairing needs to occur over the coming days before we can say with confidence that THE low, not just A low, is in. For that, I’d like to see the S&P 500 reclaim its 50-day simple moving average and the iShares Iboxx High Yield ETF (HYG) also begin to trend higher and see strong fund inflows.
I would also like to see a strong surge in momentum of enthusiastic buying that has accompanied other bottoms. While we are clearly oversold (see middle panel) we need to see a surge in demand (bottom panel) for the final element of a market bottom. Currently, we’ve only seen 8% of the Russell's 3000 members generate a MACD buy signal in the last 10 days. For a solid bottom to be in place we need to see this number jump at least over 15% and ideally higher for a stronger signal. I’ll touch back on this indicator later in the week for an update and provide any other clues as to the market’s direction.
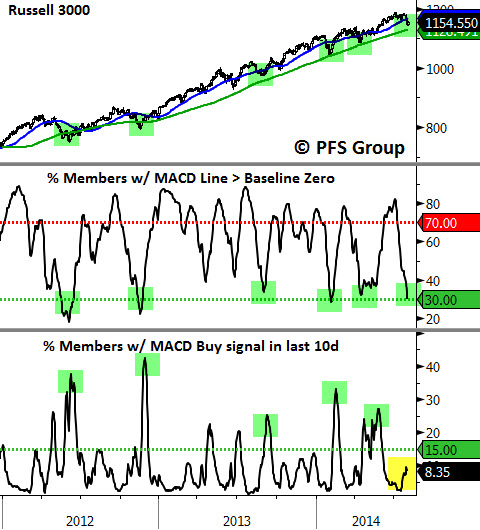
Source: Bloomberg


