Back in March I penned an article showing that leading indicators for employment were forecasting further job gains, which would also support new highs in the stock market. Since then the employment picture has only improved and now suggests the markets continue to rally into the fall.
Leading Employment Indicators Suggest New Highs Ahead
While general employment indicators are confirming the markets move higher, leading employment indicators suggest continued payroll gains ahead and, thus, higher stock prices. Shown below are two indicators, US Job Openings and the Conference Board Employment Trends Index, that both suggest payrolls continue to climb heading into early October.
Another leading employment indicator is the Fed’s Senior Loan Officer Survey, which measures the percentage of banks tightening lending standards for Commercial and Industrial (C&I) loans to small firms. The survey leads employment growth by one quarter and suggests that payroll growth accelerates from present levels heading into the fall with the big acceleration coming in May, with May’s payroll data being released on Friday June 7th.
Conference Employment Trends Index Suggests No Risk of Recession
Looking at the long-term history of the Conference Board’s Employment Trends Index paints a very encouraging picture. Shown below is the Employment Trends Index along with its 20-month moving average (20-Mo MA). As long as the index is above its 20-Mo MA the economy has been in expansion mode and the stock market is in a bull market. However, several months before the onset of a recession the index falls below its 20-Mo MA serving as an early warning for investors. The Employment Index also tracks the stock market closely though with less volatility and as long as the Employment Index is heading higher dips in the market typically serve as good buying opportunities.
Market Momentum Supports Bullish Outlook
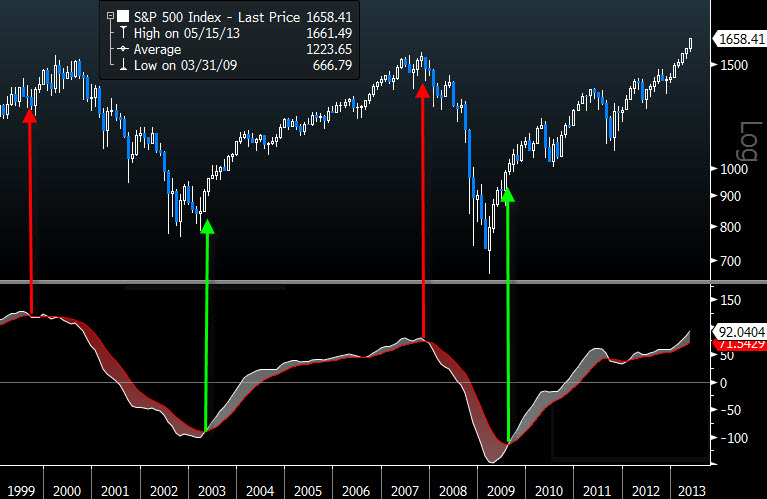
Typically prior to major tops in the market you see weakening momentum, not strengthening as is the case presently. One tool used by market technicians is the MACD, where monthly signals are used for long-term momentum, weekly signals for intermediate momentum, and daily signals for short-term momentum. Shown below is the percentage of the S&P 500 members with buy signals over various time frames. What is very encouraging is that the market is showing strengthening long-term (monthly) momentum as the percentage of S&P 500 members with monthly MACD buy signals continues to increase and is well above the level seen when the market peaked back in September 2012.
The S&P 500 itself is still on a monthly MACD buy signal with the last signal coming in early 2012. As long as the S&P 500 remains on a monthly MACD buy signal the market should be given the bullish benefit of doubt.
Summary:
Leading indicators for the labor market suggest we get an acceleration in payroll gains heading into the fall, which is what the market may be discounting currently as it continues to hit new all-time highs. With the market’s long-term momentum continuing to improve and the outlook for employment encouraging, the risks of a recession and/or bear market appear remote with the market likely heading to new all-time highs into the fall.


