


The markets were able to break out to another all-time high as the S&P 500 (SPX) hit 1867.92 intraday today and closed at 1859.45 by rising 1.26% this week. Small cap stocks like the S&P 600 lead (+1.88%). Defensive sectors like Telecom (-0.52%) and utilities (-0.41%) trailed.
The big concern heading into this week was the weakness in financials and the consumer discretionary sectors as they make up 30% of the S&P 1500’s market cap. This week the consumer discretionary sector did improve by rallying 2.43%, but the financial sector has yet to wake up. We may need a steeper yield curve for that to occur.
While we have advance-decline lines and the major indexes at all-time highs, selectivity is clearly building in the markets as fewer stocks are hitting new highs, which poses the risk of a bigger decline down the road.
Follow the Money – Weekly ETF Flows
This past week was another good week for the stock market as nearly $3B flowed into large cap stocks like the SPDR S&P 500 ETF (SPY) and the iShares Russell 2000 ETF (IWM). Emerging markets stocks continue to see strong outflows as just under $1B flowed out of the iShares MSCI Emerging Markets ETF (EEM) and the Vanguard FTSE Emerging Markets fund (VWO).
We saw an interesting development where just under $2B flowed out of one technology fund (Technology Select Sector SPDR, XLK) and $1.5B flowed into another (PowerShares QQQ Trust, QQQ). At first glance it doesn’t make much sense as both are heavily weighted towards the technology sector, but looking at their industry components (see second table below) reveals an investor switch from telecommunications to biotechnology. This shouldn't be a surprise as, again, this week the S&P 500 telecommunications sector was the worst performing sector.

Source: Bloomberg

Source: Bloomberg
Market’s Bill of Health
S&P 1500 Member Trend Strength
For gauging the market’s trend we look at the S&P 1500, which encompasses the S&P 500 Large Cap stocks, the S&P 400 Midcap stocks, and the S&P 600 Small Cap stocks, and comprises more than 90% of the entire US market cap.
As shown below, the long-term outlook for the S&P 1500 is clearly bullish as 72.0% of the 1500 stocks in the index have bullish long-term trends. The market's intermediate-term outlook moved up another notch as it moved into bullish territory by moving to 62.6% this week from last week’s 56.2% reading. The market’s short-term trend also was upgraded this week as it moved up two notches into bullish territory at a 69.4% reading, up from last week’s 40.2%. Currently we have bullish trends in all three time frames of the markets.

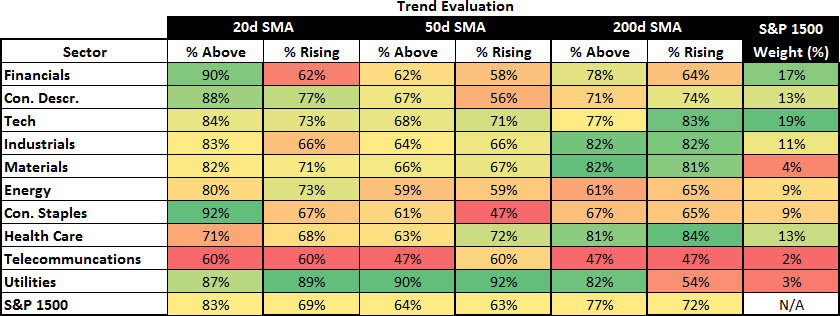
* Note: Numbers reflect the percentage of members with rising moving averages: 200-day moving average (or 200d MA) is used for long-term outlook, 50d MA is used for intermediate outlook, and 20d MA is used for short-term outlook.
The most important section of the table below is the 200d SMA column, which sheds light on the market’s long-term health. As seen in the far right columns, you have 72.0% of stocks in the S&P 1500 with rising 200d SMAs and 77.0% of stocks above their 200d SMA. Also, eight out of ten sectors are in long-term bullish territory with more than 60% of their members having rising 200d SMAs, with the utility and telecom sectors the only ones with a reading below 60%, at 54% and 47% respectively.
One recent area of concern was that the financial and consumer discretionary stocks have had weak recoveries since the February lows. The concern with weakness in these key sectors lies in the fact they represent 30% of the S&P 1500 and are acting as a brake to the market’s current rally. However, this week we saw the consumer discretionary sector play catch-up as this week’s top sector as the S&P 1500 Consumer Discretionary Index rallied 2.43% while the S&P 1500 Financial Index kept pace with the market and rallied 1.25%.
Source: Bloomberg
S&P 500 Market Momentum
The Moving Average Convergence/Divergence (MACD) technical indicator is used to gauge the S&P 1500’s momentum on a daily, weekly, and monthly basis. The daily MACD flipped back to a buy two weeks ago for the S&P 1500. The weekly signal is close to flipping back to a buy and, most importantly, the monthly buy signal given in 2012 remains in force as the market’s long-term momentum remains solid.

Source: Bloomberg
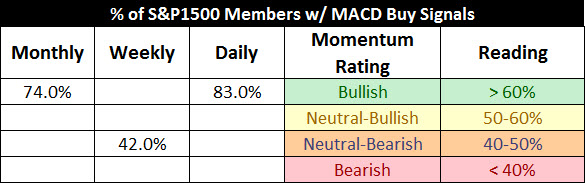
Digging into the details for the 1500 stocks within the S&P 1500 we can see that the daily momentum for the market has improved markedly from a reading of 17% three weeks ago to 83% this week. As stated in the past, readings below 20% are associated with short-term bottoms and why the rally off the February lows was not surprising.
The intermediate momentum of the market also improved by inching up to 42% from last week’s 37% reading, bumping it up one notch to neutral-bearish.
The market’s long-term momentum remains solid at a strong 74% this week, putting it well into bullish territory as the market’s long-term momentum remains steady. The best way to read the table below is that we are still intermediate-term oversold in a bullish market with an improved short-term picture from last week.
Source: Bloomberg
52-Week Highs and Lows Data
What continues to be encouraging about the market is that new 52-week highs continue to dominate new 52-week lows. Looking at the various market cap segments shows the greatest strength in the S&P 500 large cap index with small caps (S&P 600) showing the weakest performance.

Source: Bloomberg
The weakest link for the market remains to be financials. The health care sector continues to remain a market leader with consumer staples moving up the ranks.

Source: Bloomberg
One area of concern is the lack of expansion in new 52-week highs as the market approaches a former high. This suggests the market’s internal strength is not strong enough to push through resistance on this first try and that we likely have more backing and filling in the weeks ahead before new highs are seen.

Source: Bloomberg
Market Indicator Summary
Below is a multi-indicator chart of breadth and momentum in the S&P 500, which shows we reached an oversold condition in early February and have snaped backed to an opposite extreme. Last week I said that given three of my four intermediate-term indicators were very overbought, I expected sideways to downward movement in the markets this week. For much of this week the markets traded sideways and helped to bring down my indicators to a neutral reading, which allows for more upside potential before the markets become overheated again on a short-term basis.

Source: Bloomberg
Summary
The most important take away from this report is that the long-term trend and momentum of the market remain deep in bullish territory. The markets have rallied off the February lows and were struggling to hit new highs as the financial and consumer discretionary sectors had failed to rally materially off their lows. However, the consumer discretionary sector was this week’s strongest sector and helped propel the markets higher. While seeing all-time highs in the major indexes and advance-decline lines is encouraging, I’m becoming progressively more concerned given the lack of expansion in new 52-week highs. This suggests this market is getting more selective, which can be difficult to navigate and suggests the market's rally is advancing from a weaker base. If we see momentum slow in the weeks ahead with breadth continuing to struggle to expand, we may be in store for a deeper decline than was seen in January and February.


