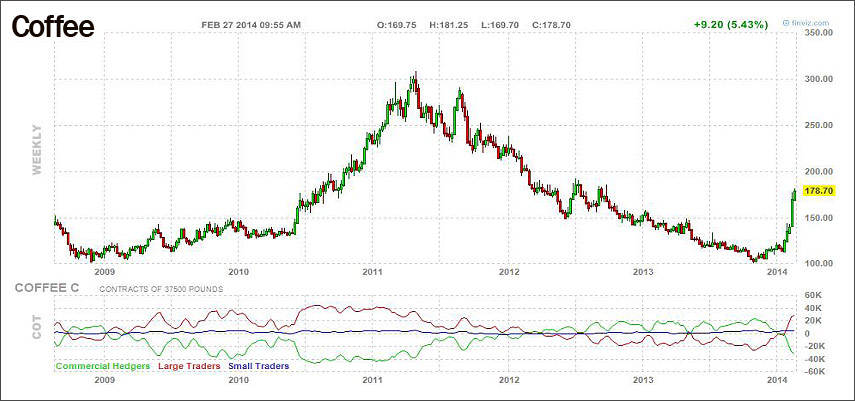
Much has been reported about the recent surge in coffee prices but sugar prices have also risen to multi-month highs due to drought conditions in Brazil, the world's number one exporter of these commodities. Brazilian coffee and sugar producers and analysts have been slashing their production estimates as hot, dry weather threatens 2014′s crops. According Somar Meteorologia, a Brazilian weather service, January and February have been the driest months in Brazil in 30 years.
Not Just Coffee and Sugar… and Not Just Brazilian Farmers Experiencing Challenging Weather
Some global agribusiness analysts are looking at the impact of too much rain in Indonesia as damaging that country's large cocoa harvest, and in North America, brutally cold winter may have damaged the wheat crop. With respect to other grains, in the U.S, farmers are expected to plant less corn in 2014 and more soybeans to take advantage of already high soybean prices which is bullish for corn.
While soybean prices may have been strong for some time, corn and wheat prices turned higher in recent weeks after prolonged declines. In fact, after a rough 2013 — in which the GSCI Agriculture Index suffered its biggest decline since 1981 at down 22 percent — the index has rebounded about 6 percent in the first two months of 2014.
Corn beginning to firm up after a weak 2013.
Source: Bloomberg
Wheat too is starting to bounce off of multi-year lows.
Source: Bloomberg
[Must Listen: Ned Schmidt: 2014 Will Be the Year for Commodities]
Living Standards Cannot Escape Rising Food prices
Food may not make up as significant a percentage of consumers' budgets in the developed world as it does in lesser developed countries, but the impact of rising global food prices is profound wherever one lives. This is why we watch food commodities closely.
Food items may only represent less than 10 percent of the consumers' budget in the U.S., but it can be 50 percent of an Indian's or Chinese person's total spending. In our Guild Basic Needs Index which we publish in these letters and at gbni.info food components represent 30% of the index. The GBNI index only contains, necessary, basic, essential, needs (Food, Clothing, Shelter, and Energy), and is not meant to track all spending.
In the 14 years of data collected, the basic, essential needs in our GBNI Index are up over 86 percent. This works out to an annual increase of about 4.5 percent versus about 2.4 percent for the government's often-adjusted, manipulated, and managed Consumer Price Index (CPI).
The GBNI is also getting a boost from non-food items lately.
Also conspiring to send or GBNI higher lately is the recovery in real estate prices and rising energy prices. The entire commodity complex looks firmer in 2014 than it has been the past few years, which could accelerate inflationary expectations—which will have a profound effect on central bank policy, interest rates, and on global markets. Stay tuned.
Rising cost of essential, basic needs can be tracked at gbni.info.
For more commentary or information on Guild Investment Management, please go to guildinvestment.com.


