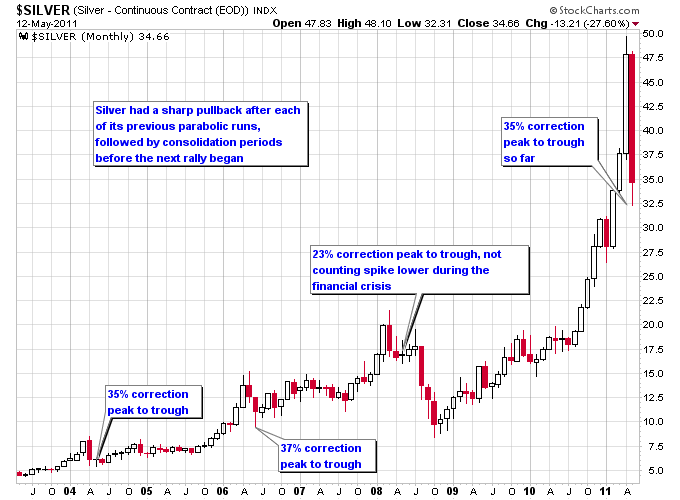
Silver’s destiny with its 200-day moving average appears to be sealed this week as a brief bounce earlier in the week failed at the 50-day moving average. From peak to trough so far this correction has run about 35%, which is still less than the 37% correction silver underwent from its parabolic peak in 2006. And the rally in 2005-2006 for silver was dwarfed by this recent run. In 2005-2006 silver went from $6.64 to $15.21 for a 129% gain. The 2010-2011 rally took silver from $17.22 to $49.75 for a 189% gain. So if this recent silver parabola follows the “higher they rise, harder they fall” rule then we should see a bigger correction than 37% peak to trough.
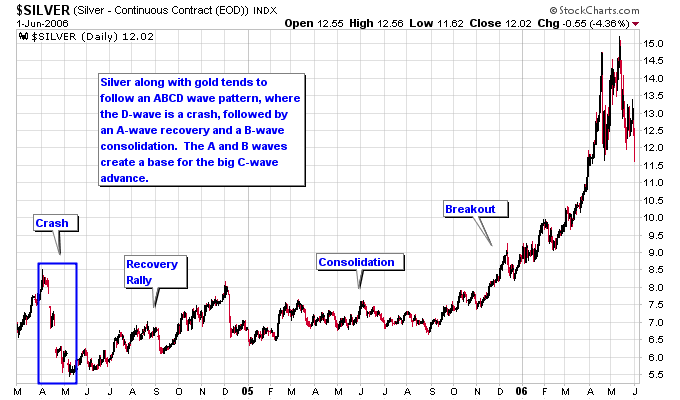
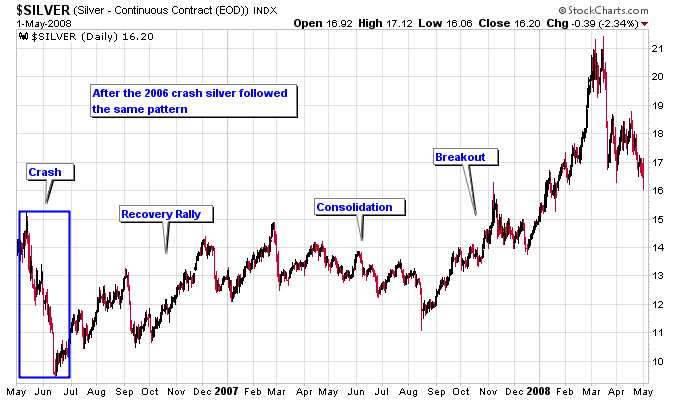
Silver has followed a repetitive spike, crash, and consolidate pattern during this silver bull market. The bulk of each crash lasted approximately two months, so if this crash follows the same pattern it should bottom sometime in June. Then silver should stage a recovery rally. The recovery rally has tended to be followed by a consolidation period, where silver just grinds sideways. If the crash is the “scare you out” phase, then the consolidation after the recovery rally is the “wear you out” phase. The goal of both of these phases is to recreate the wall of worry necessary to drive the next major rally.
Markets typically need time to repair the damage after a crash and that is essentially what the recovery rally and consolidation phases accomplish. It usually takes a period of time and multiple attempts for a market to overcome the resistance created by a sharp crash. Therefore silver investors should adjust their expectations and prepare for a sideways grind after the current crash has run its course. Expecting silver to race back up to 50 and make new highs right away is not out of the realm of possibility, but it isn’t probable based on how markets normally behave.
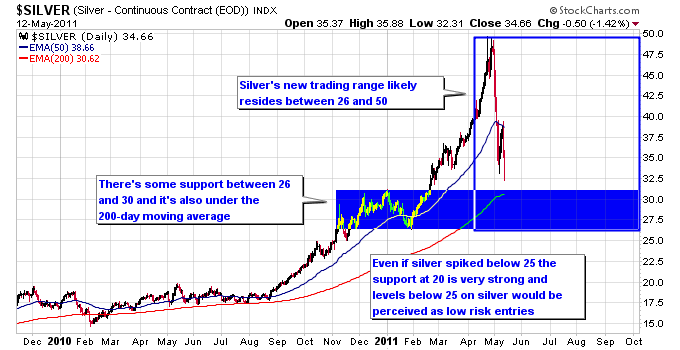
Based on past precedent the new trading range for silver is likely to be from the mid-20s to the recent high right below 50. There’s some support on the chart between 26-30 and this zone also resides underneath the 200-day moving average, so that area would likely prove tough to penetrate to the downside.
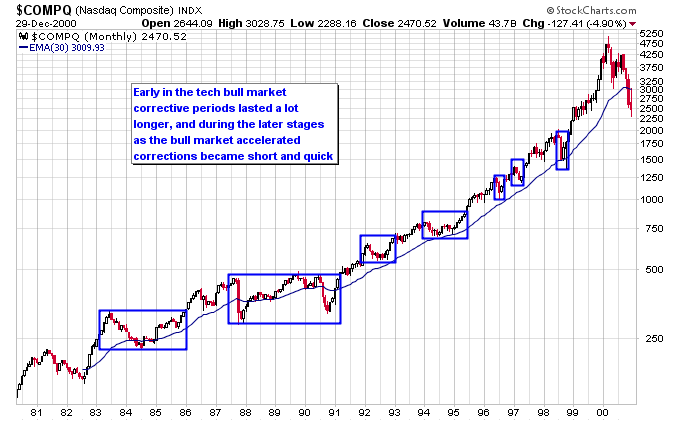
It should be interesting to see how long it takes silver to repair the damage done before it can attempt to stage a real breakout past 50. One important thing to note about bull markets is they tend to overcome corrections quicker as the bull market becomes more mature and accelerates to the upside. This next chart of the tech bull market shows how the market consolidated for years at a time early in the bull market, but later in the bull market it only took a matter of months to complete each consolidation period.
Source: Next Big Trade
