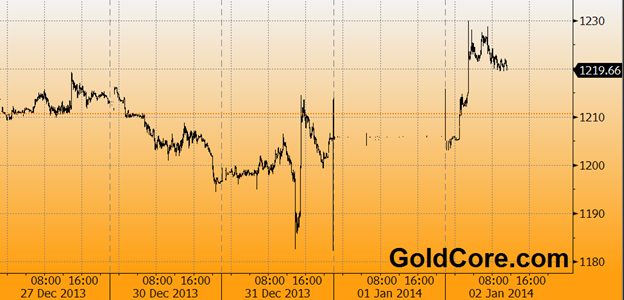
Gold and silver prices surged higher today in the opening hours of trade in 2014. Gold rose 1.8% to $1,220/oz and silver surged over 3% to $20.02/oz.
Gold fell 28% in 2013, while silver recorded a 36% decline. It was gold’s first annual drop since 2000 and gold and silver’s worst performance since 1981 and 1984 respectively.

Gold in U.S. Dollars, 5 Days - (Bloomberg)
Gold fell as low as ,182/oz briefly on the last day of trading (12/31) on Tuesday after another large sell order in illiquid COMEX trading pushed prices lower to test support at ,180/oz. Gold bounced sharply from support at ,180/oz to close the year above the psychologically important ,200 level at ,205.55/oz.
Overnight in Asia, physical buyers scooped up physical gold on this latest dip in prices to 6 month lows. Reuters reported bargain hunters stepping in to buy beaten down gold and silver, notably Chinese buyers. The Lunar New Year falls at the end of this month, and the Chinese holiday always sees strong store of wealth demand from Chinese buyers.
China is set to become the world’s largest buyer of gold in 2013 and the ramifications of China’s huge demand for physical gold, both from the Chinese people and the People’s Bank of China is yet to be realised and factored into prices.
Chinese buyers are of increasing importance but it is important to note that physical demand rose significantly throughout the world in 2013 despite falling prices. This is seen in the levels of demand experienced by leading bullion dealers, refiners and government mints. This is clearly seen in the data released by the Perth Mint and the U.S. Mint which both saw increased demand for physical gold coins and bars in 2013. Other mints have yet to report their numbers.

Gold in U.S. Dollars, 1 Year - (Bloomberg)
The Perth Mint of Western Australia reported that they saw a very significant increase in sales in 2013 despite the falling prices. Gold sales from the Perth Mint, which refines most of the bullion from the world’s second-biggest producer Australia, climbed 41% last year.
Sales of gold coins and minted bars totalled 754,635 ounces in 2013 from 533,333 ounces a year earlier, according to data from the mint.
Silver coin sales surged 33% to about 8.6 million ounces from 6.5 million ounces in 2012, according to the Perth Mint.
Gold bullion sales expanded 12% to 58,944 ounces in December from 52,700 in November and about 51,778 ounces in December 2012, according to data from the mint. Gold sales fell to as low as 30,430 ounces in August and peaked at about 112,575 in April, when gold was hammered 14% lower on the COMEX in just two days.
Silver coin sales were 845,941 ounces last month from 807,246 in November and 452,389 a year earlier, it said.
The U.S. Mint also saw an increase in physical gold sales and sold 14% more American Eagle gold coins last year and sales climbed 17% to 56,000 ounces in December from November, according to data on the mint’s website as reported by Bloomberg.
Jim Rickards, monetary expert and author of Currency Wars explained to Deirdre Bolton on Bloomberg Television's "Money Moves" that gold has fallen in price in 2013 despite “skyrocketing demand.”
Rickards said that the price fell in 2013 due to “some technical reasons” and “probably manipulation as well”, meanwhile physical supply is disappearing and leaving the gold ETF the GLD and going straight to China - to the people,
Meanwhile, global demand for gold is skyrocketing as people lose faith in paper currencies. This will lead to a huge rally in gold to over ,000/oz and “at some point you are going to want your gold and there is not going to be any around.” See video here.
We will look at this more closely and indeed the outlook for gold in our GoldCore Review of 2013 and Outlook 2014 tomorrow.


