Trying to predict macroeconomic future is like trying to catch a fox…it is notoriously difficult, but if the fox keeps killing your hens and cats, you have an incentive to do so. This point was made evident by the 2008 experience where many investors and money managers found that overlooking macroeconomic considerations was hazardous or fatal to their favorite pet investments.
In 2007-2008 the foxes were subprime loans and the housing bubble; now it appears that Greece and the other PIIGS are playing the role of foxes in the henhouse. Everybody knows that the PIIGS are a house of cards, and the topic has moved to something not discussed in polite company to the headlines, as hedge funds and other money managers have continually pushed the issue much as they did with subprime in 2007-2008.
There are two questions that arise from this comparison:
- Is the problem comparable, both in terms of size and degree of insolvency?
- What is the timing associated with the event?
This article will try to look at the second question – regarding the timing of macroeconomic activity, particularly in comparison to the 2007-2008 timeline. I would comment in advance that I am not saying that there is any guarantee that the Euro-zone debt crisis will mirror the subprime crisis in either scope or direction, but the perception of this possibility certainly exists in the markets currently.
In trying to get a handle on timing, we’ll look at 6 things:
- Crude prices and the possibility of a crude oil price shock.
- The term structure of various sovereign debt markets
- Dr. Copper
- ECRI Leading economic indicators
- OECD Leading Economic Indicators
- Consumer Confidence, expectations versus current conditions
Oil Price Shocks: Inconclusive but Potentially Bearish
There are many theories about if and how oil prices negatively affect the economy. In 2007-2008, oil prices moved far outside the band that consumers were used to paying and they did so suddenly, moving from $90 to $147 in less than a year. In contrast, prices in 2011 simply moved back to the range that consumers saw in 2008, and the movements were not as drastic on a percentage basis. Still, without question the prices are high relative to time periods prior to 2007, and also compared to 2009-2010. Recently, there has also been a spate of articles discussing how crude oil needs to fall below $90 to not cause a recession. In general, I disagree with picking a set price or percentage of GDP that crude oil price and expenditures have to stay below. The statistical evidence is more robust for models that specify that sharp and sudden movements above prices that consumers are used to paying will result in a recession 1-4 quarters later (you can access previous articles discussing these models here and here). Testing for whether we have are likely to have a recession based on oil prices returns mixed results. Using a 2 year shock variable where consumers “forget” prices within two years, we could expect a mild shock from the prices in Q1 and Q2 of 2011 (Figure 1). If this specification is accurate, we could expect a maximum drag of 1-2% of GDP below trend and to have its maximum effect now through Q1 2012. Using a 3 year shock variable where it takes 3 years to “forget” prices results in no shock from the 2011 prices and no statistically significant prediction of a recession (Figure 2). If oil prices were the only headwind on the economy, then it is likely that equity markets have significantly overreacted to the downside in the past couple of months.
Figure 1: The predicted effect of oil prices on GDP using a shock variable with a two-year consumer “memory.” The negative effect on GDP would be akin to 2005-2006, and significantly less than the 2008-2009 effect. (Data source: EIA – Refiner Acquisition Cost, St Louis Fed)
Figure 2: The predicted effect of oil prices on GDP using a shock variable with a three-year consumer “memory.” The negative effect on GDP from oil prices in 2011 would be negligible using this specification. (Data source: EIA – Refiner Acquisition Cost, St Louis Fed)
Term Structure of Important Sovereign Debt Markets-bullish
One of the most important and significant historical predictor of recessions has been the difference between the two and ten year yields in sovereign credit markets. Historically, when the two year yield exceeded the ten year yield it was taken as a sign that credit in the short term was too hot and would choke off economic activity as the marginal attraction of capital was to short-term debt markets rather than other investment opportunities. In the case of sovereigns at risk of default, it can also be seen as a sign that a country could potentially default on its debt as the cost of a default in the short term gets priced in more aggressively in the front of the curve (this is because if the country does not default in the short-term than the interest rate for the longer maturity bond would continue to pay for many more years than the short maturity bond.)
Looking at the term structure of important developed (Figure 3) and developing markets (Figure 4), one does not get the sense that a recession is impending, with the possible exception of Brazil. The caveat to this claim however is that short term interest rates are frozen at or near zero percent in several of the most important sovereign markets in the world – namely the US and Japan. If capital is not attracted to investment even with interest rates at zero, then using this indicator for these markets is seriously flawed. Given the current dynamics, the analysis would need to include extraordinary monetary actions – and historical comparisons for quantitative easing is a different analysis. Nevertheless, it is notable that for economies that are not stuck at ZIRP (zero interest rate policy) only Brazil has had an inverted yield curve over the last 12 months.
Figure 3: Developed markets are still showing very healthy 2-10 year spread in treasury yields. Even in the last recession, yield spreads dropped below zero a healthy 7 quarters in US, UK, and Australia before the recession took hold. This positive spread should be a tailwind to economic activity, but is complicated by ZIRP. (Data: Bloomberg)
Figure 4: Developing markets 2-10 year spreads have dropped close to zero in the past 12 months, and have been below zero for Brazil since late 2010. This is a bit more of a red flag, and it is in the economies that represent the fastest growing elements of the world economy. However, there is generally a lag of several quarters between when a spread goes negative and the associated recession, so this would imply that only Brazil is currently at risk of a recession. (Data: Bloomberg)
Dr. Copper
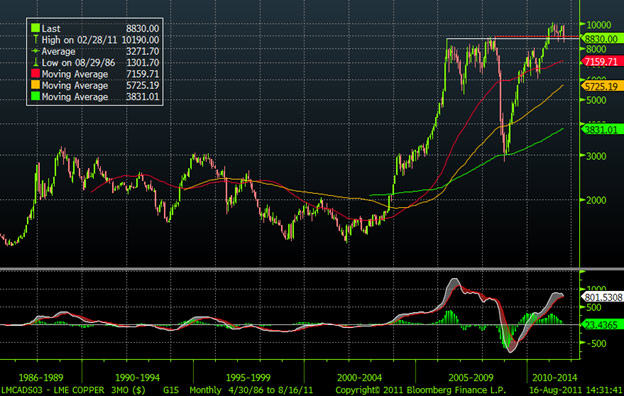
According to folklore, copper is the metal with a PhD in economics. This is because it is used so heavily in infrastructure, so the price of copper can give a good indication of investment demand and economic activity more generally. Unfortunately, the theory does not hold up to very close scrutiny – for example copper sold off consistently through the decade of the nineties which was of course the greatest bull market in history. Still, copper prices did start to fall 6 months in advance of the 2001 recession and started to fall in July of 2008, two months in advance of the major stock market carnage of 2008. Currently, copper prices have sold off roughly 10% from their high, but remain in the trading range of the past 12 months. Copper prices would need to break decisively below /pound or 00/MT before this would be a serious sign of economic weakness.
Figure 5: Copper prices 1986-present. Although prices have sold off in the past month, this is not sufficient to make a call for economic weakness ahead. Due to the many factors impacting supply and demand, prices of copper can be volatile regardless of macroeconomic forces – case in point copper fell 40% between June 2006 and February 2007 which was during an expansion.
ECRI US leading economic indicator:
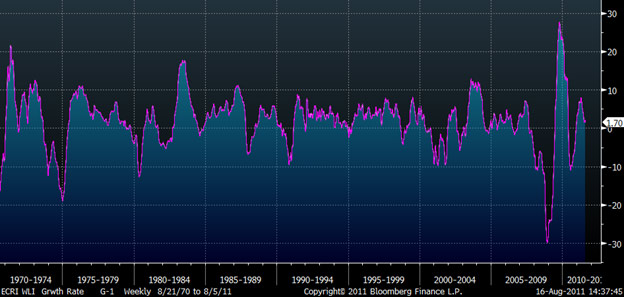
Figure 6: ECRI Weekly Leading Index of US economic growth. Readings above zero indicate growth in the index. While the ECRI has an impressive record predicting the recessions of 73, 80, 90, 01, and 08, it also gave a false signal in 1987, 1999, and last year. Currently the reading is weakly positive at 1.7. Note that ECRI was significantly negative throughout 2008, which implies that we are not currently in a period of comparable weakness. (Source: Bloomberg)
OECD Leading Economic indicators
Figure 7: Leading economic Indicators for OECD paints a similar picture to the US . Firstly, the index is still positive, albeit weakly so. Second, the index has given false signals in 1984, 1995, and 1998. IT would appear that if there is a world recession on the horizon, it is still some time off.
Consumer Confidence and Current Conditions Versus Expectations:
Figure 8: Holy pessimism batman! At 54.9, consumer confidence is lower than at the worst of 2008-2009, and is very nearly the worst reading ever. While consumer confidence gave a good warning for the 1980, 2000, and 2008 recessions, it fell concurrently with the 1990 recession. Also, note that there is a similar double dip in confidence in the early 1990s that did not match up with economic weakness. There also seems to be a remarkable correlation between consumer confidence and the price of gasoline…and the effect of gas prices on the economy has already been covered.
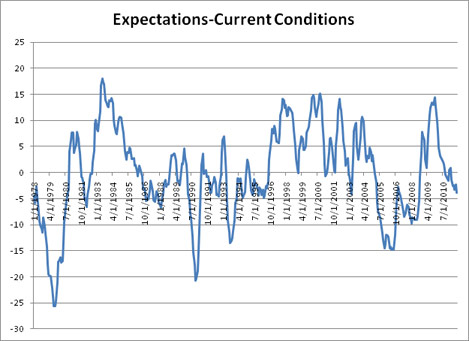
Figure 9: The Consumer Confidence index is made up of two components – expectations and current conditions. The consumer expectations number is consistently lower than consumer confidence, so the above chart weights consumer expectations by a factor of 1.24 and then subtracts it from current conditions. Readings below negative 10 match up with recessions in 1980 and 1990, but also give false signals in 1993, and 2005. The current reading of negative 4 accompanies one of the most negative consumer expectations number since 1980, and is a hair’s distance from the most negative number ever.
Conclusion
Based on this analysis, it is difficult to conclude that we are in a recession or will be in one soon. The most disturbing piece of data is the fact that we had a crude oil price spike earlier this year. However, whether this alone will tip us into a recession is debatable. For what it is worth, my interpretation is that we will avoid a recession but that growth will continue to be slow for the coming months. There are a multitude of other factors that we did not cover here: most importantly, the outcome of Euro-zone debt worries, but also the effects of the Japanese earthquake, high food costs, QE2 ending, the new Fed announcement of low interest rates frozen through 2013, and projected fiscal tightening in the US. However, each of these factors is also imperfect in predicting future economic activity level. What is without doubt is that the US consumer is exceedingly pessimistic, and that the S&P has fell 20% from its 2011 highs through last week’s lows. Darkness appears to envelope the land, and consumers think the foxes are running free!


