Coming into this week of trading it appears that we might have another period of turbulence due to struggles in the Euro zone in coming to terms with sovereign debt issues. I’m getting pretty tired of having my weekends ruined by these shenanigans. And let’s be honest…it isn’t a mystery what is going to happen any longer is it? I mean, there are various paths by which we can get there, but it seems pretty clear that the standard of living in Greece, Spain, Ireland, Italy, Portugal is going down, and that they will be joined in the not too distant future by the UK and the US. The mystery is in the path that we take to get there: will it involve a deflationary collapse? When will leaders of developed nations emerge who speak all truths, including the difficult ones? Or will those leaders never appear, supplanted by war-mongering charlatans who scape-goat foreign enemies as the false cause of misery?
These practically philosophical questions are difficult to answer, as is one interesting and popular avenue of debate: will there be inflation or deflation? Both sides seem to have convincing arguments so I’ve given up trying to figure out who is right…probably both sides are right. Perhaps it is time to look at this debate outside the box. Perhaps there is some honesty to be had simply by looking at price ratios independent of official “money.” After all, money is merely the medium of exchange by which we all have agreed (with some significant persuasion from officialdom) to use as a marker of value. But it can easily be taken out of the equation in the comparison of any 2 goods. For example, houses in the US are typically priced in dollars, as are wages. If we divide the two: (Dollars per average house)/(Dollars per average hourly Wage), we get (average house per average hourly wage), a ratio that can be viewed without the referencing of dollars. So rather than looking at prices the way we normally do, this article will examine some of the more important ratios in assets to get a feeling for relative prices.
Why the Working Person Feels Poor
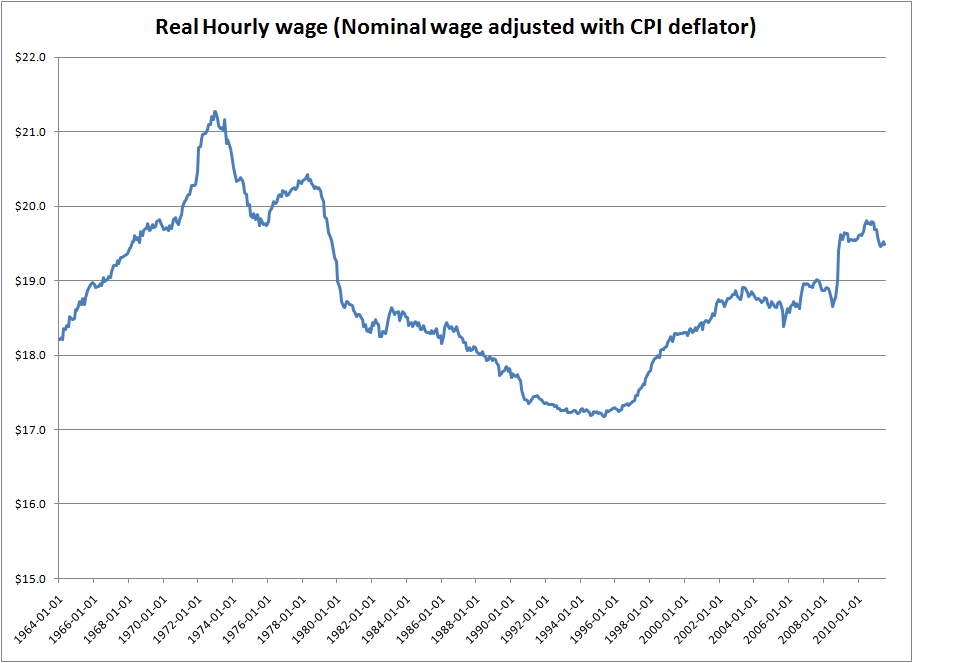
First, perhaps the most important “price” is the price of labor. Since most people receive their wages, the cheaper things are in terms of wages, the more people can afford and the better off people feel. So on any of the following chart, laborers want the “price” of labor to be high (i.e. to buy a lot). Of course, this is assuming all else is equal…obviously if debt levels are high and employment levels are low, people are not going to feel better off. But for purposes of argument, we will simply look at the price of various goods – gasoline, houses, etc. – and assume everything else is constant in terms of affordability. What emerges was somewhat surprising to me (Figures 2 through 6). Gasoline and gold are very expensive, grain costs are somewhat expensive, and houses and natural gas are on the cheap side of things.
Figure 1: Real Hourly Earnings
Figure 2: Hourly Earnings in gallons of gas. Gas is less affordable then it was in 1980-1982 for the average wage earner. The less gasoline one can afford for an hour of work, the more “expensive” the gasoline feels so for all of these charts, the lower the number the more expensive the item and the less powerful is the numeraire.
Figure 3: Weekly Earnings in Oz. of gold. The number of ounces of gold an average wage can purchase in one week has gone down drastically in the past 10 years. Note the high was close to 4 ounces of gold purchased with one week of wages back in 1970. Now the average week of wages purchases only 0.4 ounces.
Click here for larger image
Figure 4: Hourly earnings in terms of a basket of grains. The basket of grains used represents 2.5 bushels of corn, 1.7 bushels of wheat, and 1 bushel of soybeans. This basket is nearly the most expensive to the hourly wage it has been for the past 20 years. Grains are still cheaper than they were from 1964 to the mid 1980s.
Click here for larger image
Figure 5: Earnings priced in terms of housing. The number of median priced houses five year’s worth of average wage can purchase. As can be seen, houses are cheaper than at any point in the past decade, and roughly as cheap as they were 2 decades ago.
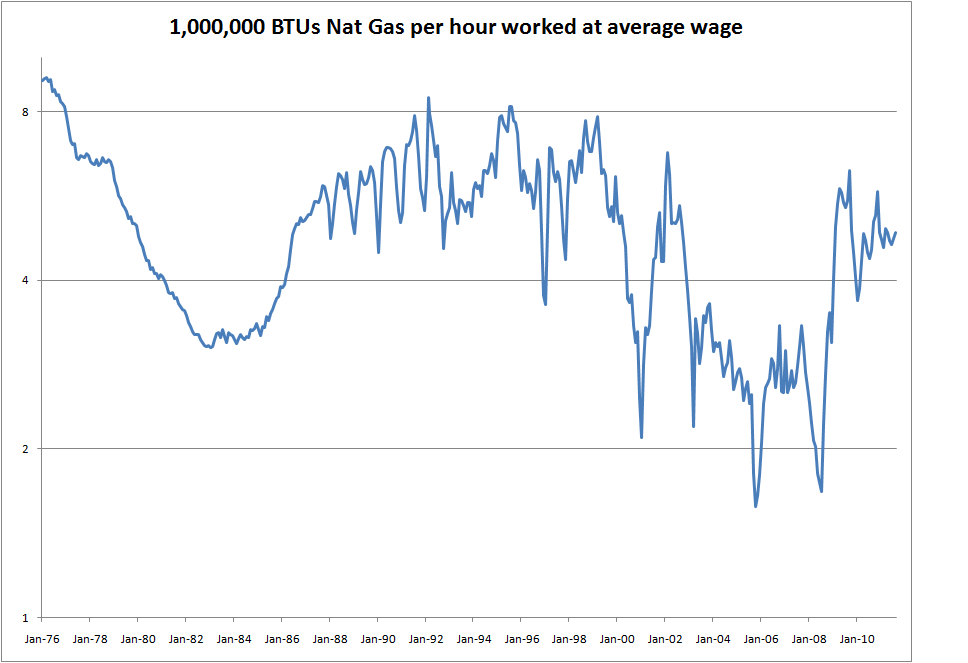
Figure 6: Hourly earnings in terms of natural gas. One hour of wages can buy nearly 5 million BTUs of natural gas at Henry Hub. In contrast to gasoline, natural gas is more than 2 times as affordable as it was through much of the past decade. In fact, natural gas is now cheaper than it was for the average wage through the 1980s as well!
Gold Is Expensive
Obviously, since gold is at record levels in terms of the dollar, everything is going to seem cheap priced in terms of gold. Still, it was an eye opener to me to see just how cheap things have gotten priced in gold. While some people will inevitably hold out for an unrealistic level (aka “I’m gonna wait until I can buy Greece with my 100 ounces of gold”) the fact that many assets are now attractively priced in gold could be a sign that gold is getting toward a top…or that other assets will start to appreciate faster in dollar terms. Of course, in the short run this is not necessarily true as gold seems to have all the geopolitical winds at its back.
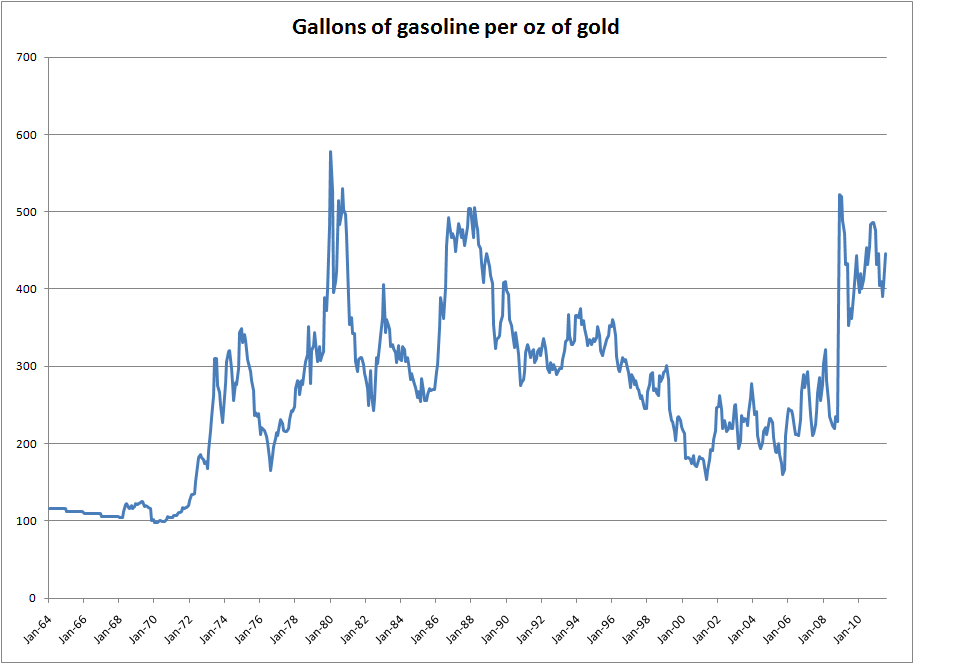
Figure 7: Gallons of gas purchased with one ounce of gold. Gasoline is relatively cheap in terms of gold, with one oz of gold purchasing 450 gallons of gas.
Figure 8: Barrels of oil purchased with one ounce of gold. Oil doesn’t look nearly as cheap on a historical basis as gasoline. This is largely because the tax rate on gasoline as a percentage basis has gone down drastically over the past 10 years. It appears there is a downward trend in the oil/gold ratio, implying oil has gotten more “dear” on average over the past 20 years. During the 2008 credit crisis (the most deflationary event in the past 50 years), the price of oil only fell to 25 barrels per ounce of gold, whereas it fell to 30 and even “cheaper” in the 1980s and 1990s.
Figure 9: Grain basket (2.5 bushels corn, 1.7 bushels wheat, 1 bushel of soy) is as cheap as ever in terms of gold. One can now buy 40 grain “baskets” for an ounce of gold, up from 5 in the 1960s, 5-10 in the 1970s, and 15-20 through most of the 80s and 90s. By this measure, grains are actually quite cheap in spite of nearing nominal highs in dollar terms.
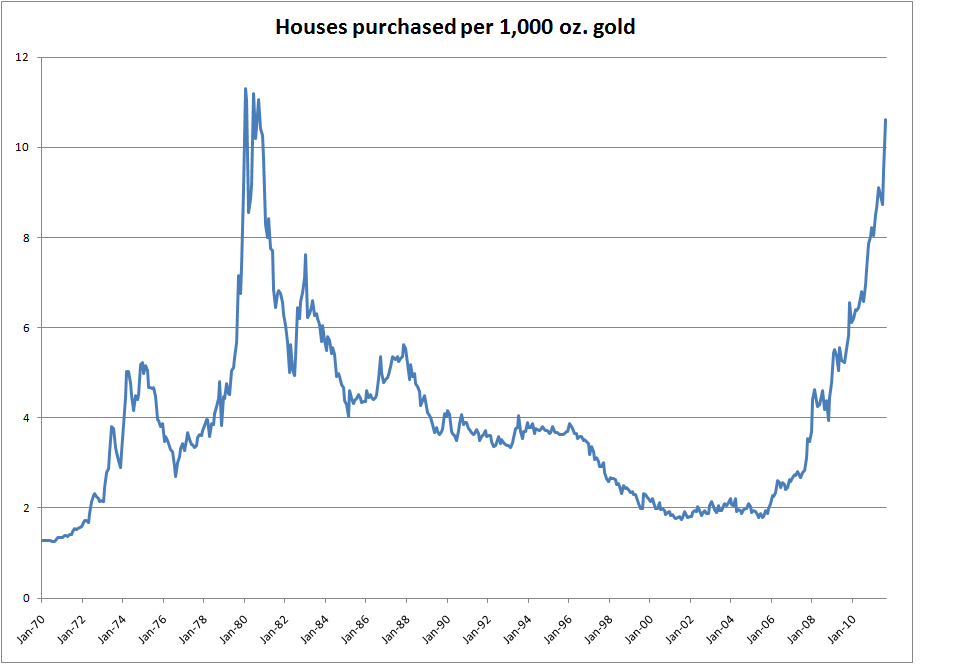
Figure 10: Houses priced in gold. The number of median priced houses one could purchase with 1,000 ounces of gold is close to a 40 year high. The average “price” of a median house over the past 40 years is roughly 250 ounces, where now a median house can be purchased with less than 100 ounces. At the peak of the housing bubble, one needed 500 ounces or more of gold to purchase a median house.
Figure 11: Natural Gas priced in Gold. Natural gas is another commodity nearing its all time low in terms of gold. One ounce of gold can purchase 450 million BTUs of natural gas at Henry Hub, after averaging just 107 million BTUs of natural gas through the decade of the 2000s. Seems like a good time to sell your gold, buy a house and heat it with natural gas! Also, if you can drive a car using natural gas, or start a business using natural gas, it may be a decent time to do so.
Oil Is Also Expensive
Once again, in the short term there is no reason not to expect for oil to get more expensive in dollar terms and relative to other commodities and prices in the economy. However, in the medium term, it is unlikely that housing, natural gas, and grains will be so cheap in the future when priced in oil. This means that oil will need to come down in dollar price, or the other asset prices will need to rise, or both.
Figure 12: Grain basket priced in crude oil. On a relative basis, grains are roughly as cheap as they have ever been in terms of oil. The trend in grain yields is much more obvious using this metric, and is interesting given the amount of political turmoil and unrest that has found its impetus in “high” food prices. Relative to oil, grain prices are decidedly not high.
Figure 13: Houses purchased with 10,000 barrels of oil. Set a new all-time high with this measure in April of this year. Housing looks cheap again from yet another perspective. Since US housing is looking so inexpensive relative to various metrics, I think it is a fair bet that there will be several tailwinds to US housing prices in coming years, which the market is currently not discounting.
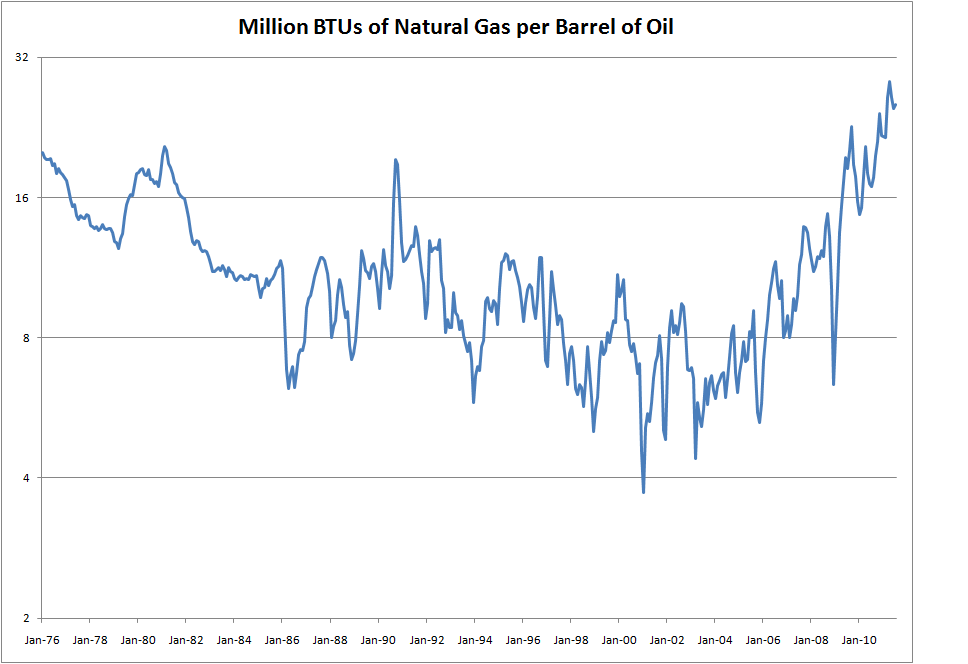
Figure 14: Millions of BTUs of natural gas purchased with one barrel of oil. Given one barrel of oil only contains 5.8 million BTUs, one would be forgiven for being surprised at the current metric. In April, one barrel of oil (5.8 million BTUs) could “purchase” 28 MBTU of natural gas! I think it is a fairly safe bet that the next five-ten years will see increased use of natural gas, decreased use of crude oil, or both. And, as with housing priced in oil, these new dynamics are only partially priced into forward expectations of the market. Four year forward price of crude oil is still 18 times the price of four year natural gas.
Conclusion
Given the extremity of current monetary and debt dynamics, it is difficult to know where the dollar and euro may be in the coming days and months. This article attempted to take some of this uncertainty out of the equation and look strictly at some ratios between goods in the economy. My conclusions are that gold and crude oil look relatively expensive, whereas housing and natural gas look relatively cheap. Obviously, these trends could stay in place for months longer if not years, as uncertainty usually leads to an economic slowdown which would in turn most likely elevate the price of gold relative to other assets. Additionally, the true crisis in crude oil supply may have been grasped by the markets, but politicians continue to dither on solutions (LNG fuel for over the road truckers being an obvious one). In the medium term though, I think we are all but assured that the relationship between these prices will revert to a more average level. At this point I’d rather own a house than gold, and I’d rather use natural gas than petroleum products.
