With harvesters now beginning to move in parts of the U.S. the reality of the drought is now being recorded. Farmers face the loss of substantial income, and in many cases actual losses. Early estimate of losses by crop insurers is $30 billion(Financial Times, 27 August). Tax payers will be paying a significant portion of that loss. Crop insurance is the mechanism for insuring that farmers can plant a crop in April of 2013.
As anyone that has experienced losses from a natural disaster well knows, insurance never covers the total cost of the experience. In addition to the financial costs is mental anguish. Together, these factors are going to make U.S. farmers stingy with their cash til September of 2013 when the next harvest occurs. U.S. farm equipment sales will certainly see the impact of the situation. Fertilizer sales will be less than might have been the case.
Risk at this time for the North American grain market is the extent that soil moisture is replenished this winter. Normal winter precipitation should bring soil moisture levels up, but may fall short of that necessary to bring it to the desired level in all areas. That could adversely impact 2013 U.S. planting of corn and soybeans.
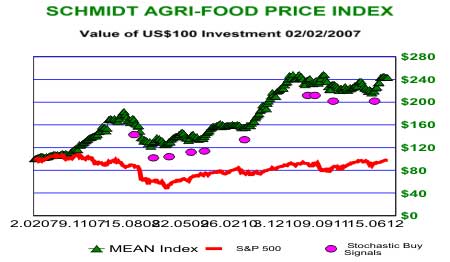
U.S. drought has tightened the global grain markets somewhat. Our Agri-Food Price Index in the above chart is just shy of a new high. A comparison with the experience of 2008 and 2010-11 shows little similarity. To date, global food prices are not demonstrating a shortage situation as occurred in those two periods.
Highest period of risk will be that through the early 2013 harvest of corn and soybeans in South America, late January-March. Those crops will soon begin going into the ground. Price of corn, top chart, and soybeans may already be reflecting both excessively over bought situations and are perhaps ignoring the impact of South America’s next harvest.
Above chart is of canola, a major competitor to both soybeans and corn. China imports canola from Canada based on availability and price comparison with those two grains from the U.S. We note in that chart that the price of canola has not confirmed the price action in soybeans and corn. That lack of divergence should be considered a large yellow flag for anyone long Agri-Commodity index products or corn.
While the U.S. corn and soybean situation is indeed strained due to the drought, the global grain as situation is not. The price action has been exaggerated by traders in the paper corn and paper soybean markets. Large speculators are long 4.7 corn contracts for each one short while for soybeans that ratio is 4.5. These are extreme positions. Traders should be exiting these contracts and selling exchange trade products based on popular Agri-Food indices. Remember that with Agri-Commodity vehicles one is not invested in commodities, but in derivatives.


