It is not exactly groundbreaking analysis to say that whats good for Gold is generally good for Silver. As observers of the precious metals know, Silver tends to lag Gold but eventually catch up quickly. In the long-term sense, Silver is still a year or two behind Gold as Gold has broken above all resistance levels. Technically speaking, we do favor Gold over the next few months, but ultimately, Silver is poised to catch up with vengeance.
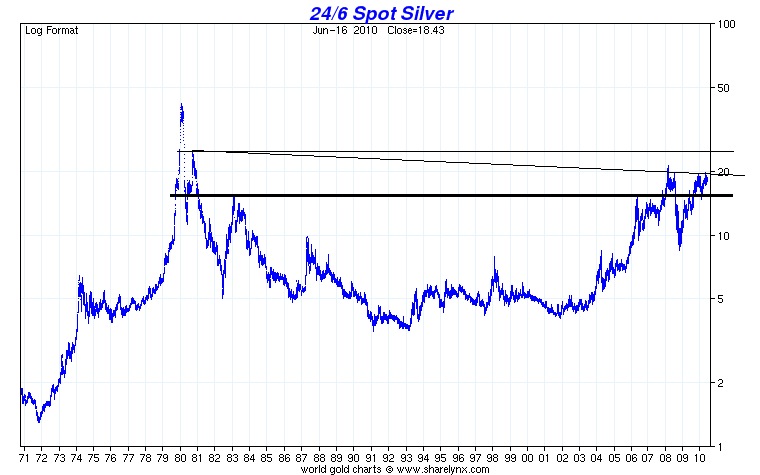
Here is a great 40-year Silver chart from Nick Laird at sharelynx.com, with my annotations.
This long-term chart shows /oz as a critical level. Silver rebounded strongly from earlier this year and is soon to attempt to break . A clean breakout and Silver should reach , which is its final long-term resistance.
This brings up the question, when will Silver break /oz?
The above chart provides some helpful hints. First, the 40-week bollinger bands are nearly tight enough (as in previous breakouts). Second, Silver has held above $17.50 despite numerous attempts to go lower. Finally, Silver is performing very well in relative terms. Silver against both currencies and commodities has already broken out past its 2008 high. On the other hand, Silver has yet to breakout against Treasuries. We are keeping an eye on that ratio as it could confirm a sustained breakout in Silver past $20/oz.
Of course no one can predict the future. We try and assess what is probable and what is unlikely. Given the macro backdrop, Gold and Silver should continue to outperform going forward. When we look at the technical backdrop for Silver, we see what is “probable” should the metal eclipse and hold the $20/oz barrier.
Good luck and keep your eyes on Silver!


