Common knowledge tells us that to forecast recession with some lead (advance warning) means we need to use leading indicators. However a special characteristic of the 50 state-wide co-incident indicators maintained by the Philadelphia Fed allows us to build an early warning system for recessions.
In our previous research titled “Dating NBER Recessions with Philadelphia Fed State coincident indices” we showed how a specific sub-set of 50 US states were more “sensitive” to recession and allowed us to date recessions in a co-incident fashion with a very high degree of accuracy (an r-squared of 0.96 to NBER which is very high.) You can also download a PDF version of this research we published in 2011 for peer-review at the Social Sciences Research Network (SSRN).
We extended upon this research methodology to try and see if we could find a sub-set of 50-US states that would serve as “Canaries in the coal mine” and accurately date NBER recessions and 3 months prior. This would establish if we could find a sub-set of US states’ co-incident indicators that provided advance warning to recession. We do this by tacking-on 3 months of recession onto each official NBER recession start and then building a positively weighted composite index from the co-incident indices of the 50 US states that has an optimized statistical regression to the “new” NBER dates.
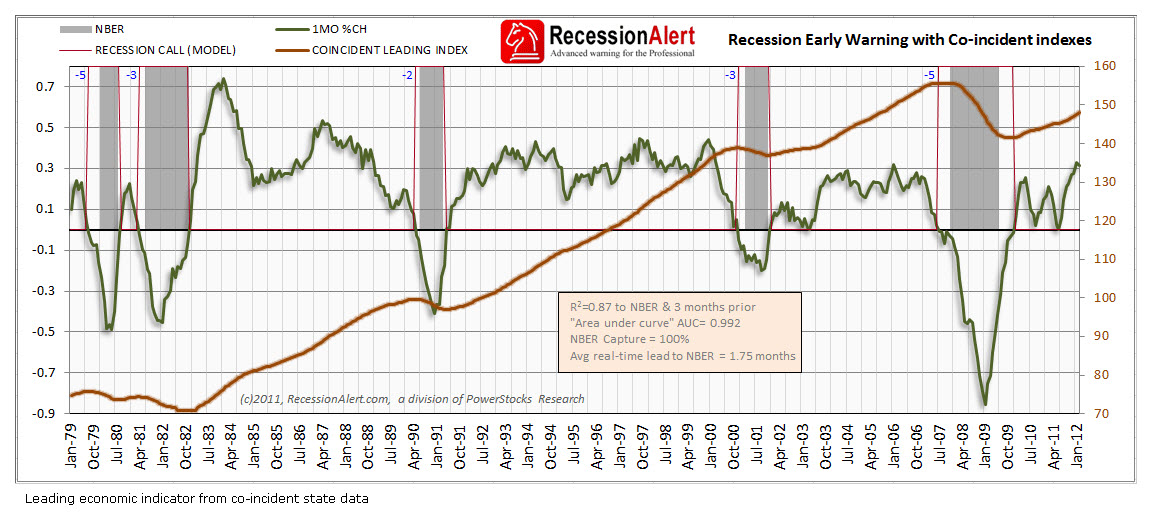
This exercise aims to give 3 months advance warning of a U.S recession using co-incident state-wide data . The resulting composite index does a very decent job providing 2 to 5 months (avg=3.75 months) warning. Given the index inputs are 1 month post and the data is published by the Filly fed toward the end of the month, this gives the real-time observer a 2 month lag on published U.S state-wide coincident data and thus the look-ahead model gives 3.75-2= 1.75 months average real-time advance warning of recession.
The chart below shows the performance of the Leading indicator constructed from a subset of state-wide co-incident indices (brown line). The month-on-month rate of change is shown as the green oscillator that acts as our recession signal line. When it falls below zero we call warning of recession and when it rises back above zero we call the end of the recession. The small blue numbers indicate how many months in advance of the eventual recession the system was able to provide us with a warning. We note that the leads are fairly consistent with a small standard deviation:Click image for larger view
The timeliness in flagging the end of recession is less impressive, but the aim here was to construct a recession warning system more than a proper dating system. Having said this, the Area Under the Curve (AUC) of this model is a remarkable 0.992 meaning it is 99.2% accurate in categorizing recession (plus 3 months prior) and expansion months correctly. It is also prudent to point out that the statistical model was constructed by us about 7 months ago using data up to and including the last day of the 2008 great recession and as such the recordings of the model post February 2010 are all out of sample. It is the satisfactory out-of-sample performance of this model that has resulted in us deciding to release the model for our client base from now on.
Although the new weighted index consists of positive weightings of all 50 US states’ coincident economic indices, the index is dominated 98% by 12 of the 50 U.S states as shown below with their respective weightings in the new composite index:
- KY (Kentucky) 27.67% ,
- RI (Rhode Island) 13.68%,
- MT (Montana) 13.66%,
- MA (Massachusetts) 11.90%,
- FL (Florida) 11.67%,
- MN (Minnesota) 7.02%,
- HI (Hawaii) 4.87%,
- SC (South Carolina) 2.91% ,
- TN (Tennessee) 2.76%,
- ME (Maine) 1.87%,
- IN (Indiana) 0.95% and
- IA (Iowa) 0.28%
These are the states that seem to “react earlier” to signs of recession than the others and hence give us the advance warning we require. It is interesting to note that these are fairly “nondescript” states from an economic output perspective and not the usual ensemble of US economic powerhouses. There appears to be some characterisitic of these states’ economies that render them more sensitive to recession and giving us earlier warning than the others
The chart above included data from the February 2012 vintage (published on 4 April 2012). We can see we are nowhere near recession as at April 2012, but did indeed come very close in June and July 2011. This would have been visible to the real-time observer (and our subscribers) in August and September 2011, round about when the stock market started its nosedive and when ECRI made their famed recession call. To illustrate the importance of having accurate and short-term warning to recession (read “Recession:Just how much warning is useful anyway?“), the US stock market has risen some 25% since October 2011. Had you taken fright and pulled the plug on your investments, you would have sat on the sidelines in disbelief as the markets roared ahead in a record busting surge.
The big downside with the Philadelphia Fed state-wide co-incident indices is that they only stretch back through 6 business cycles (or 5 recessions). For this reason, whilst we actively maintain a watch on them, they are kept apart from our SuperIndex methodology which has a far longer history behind it. We will use them as confirmations leading into high recession risk periods. After 2 or more live business cycles we will consider including them into the SuperIndexes.
The recession forecasting models we have and will continue to build from the Philadelphia Fed state co-incident and leading indices will start appearing as separate tabs in the weekly recession forecast report at the end of each month, since they are only updated once per month.
Source: Recession Alert


