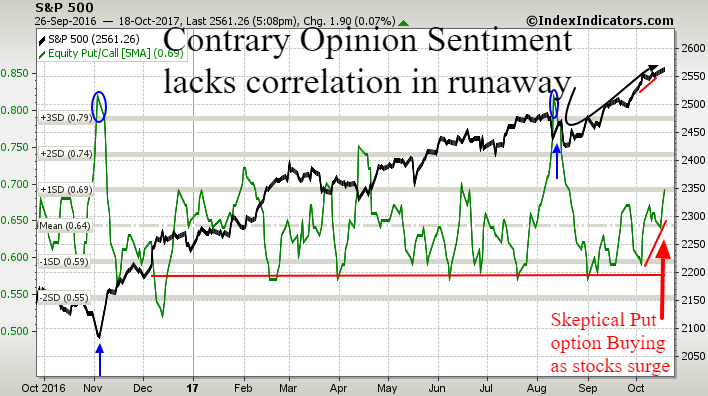
A persistent theme for 2017 has been stocks surging to record highs during each quarterly earnings cycle. The first three quarters of 2017 earnings have seen a series of 6-week explosions to the upside: February, April-May, and July. In fact, removing these three 6-week surges would leave the stock market completely flat for the year through August. The current earnings cycle is different. The predictable 6-week run to record highs this time has occurred prior to the the deluge of earnings releases. Could the expected corporate profit reports have been overly anticipated, mostly reflected in the current peak?
Normally, we would look for a strong market rally to begin now and carry into late November or early December. However, with so much buying power used up before the earnings onslaught, we suspect that momentum will be waning as we move into November. Correction risk may be minimal until we get past the earnings release climax around the 2nd week of November. The surprisingly positive earnings reports by IBM and Adobe this week are examples of why it’s a fools errand to call a market top without seat belts. Are there areas of technical concern? Absolutely! The small cap stocks along with sentiment measures such as put/call option ratios and CNN’s Fear and Greed Index have clear negative divergences throughout October with the major indices of the Dow and S&P 500 Index.
Sentiment is a contrarian indicator. When people are most negative, the investor selling power is exhausted and prices are ready to move higher. The converse is also “generally” true—when sentiment is extremely optimistic, buyers have exhausted their sideline cash and stocks become vulnerable to a market decline. Strong oversold sentiment put option buying extremes in early November and mid-August when investors were most bearish (blue arrows) signaled excellent buying opportunities. Calculating sell signals in “running” bull markets is more difficult. It’s common to see sentiment swing from oversold to overbought, as it did in November to December last year, but in a runaway phase of a bull market, stocks can be periodically overbought for months without a sufficient correction to create an oversold buying zone. The option trader sentiment reaction since September is interesting with the explosive move higher in stocks that coincided with increasing skepticism and put option buying, when normally optimistic call buying would occur as prices move higher. Should further new highs in the stock market coincide with another dip in put/call ratios below our red line, then the odds of a correction will increase. Sentiment measures will need a deeper oversold condition like August and last November and then a new rally phase before they can be relied upon for the sell side.
Consumer and small business measures have been extremely optimistic all year which supports the bigger upside picture. Some pundits think the market is soaring based upon expectations for Trump stimulus plans and tax cuts. Our sense is that most investors didn’t care when Heathcare failed and few will care if tax cuts are not passed this year. Tax cut success and repatriation would add fuel to this raging fire, but demographically-induced low inflation along with cyclical in sync global trends are driving stocks higher until animal spirits raise the cost of credit. Inverted yield curves, excessive wage inflation, tightening bank credit standards, and elevated debt service ratios are still a long way off from warning of an impending economic peak and earnings recession. Short term the market has priced in high expectations generating some overheating in the stock market, but earnings keep beating forecasts. Once stocks fall more than 3%, the odds rise quickly that the ensuing correction may climax beyond 10%. For now, the earnings are strong, the global engine is firing on more cylinders than at any point in the past decade, which warrants being prepared to use any sort of panic selling as a buying opportunity.


