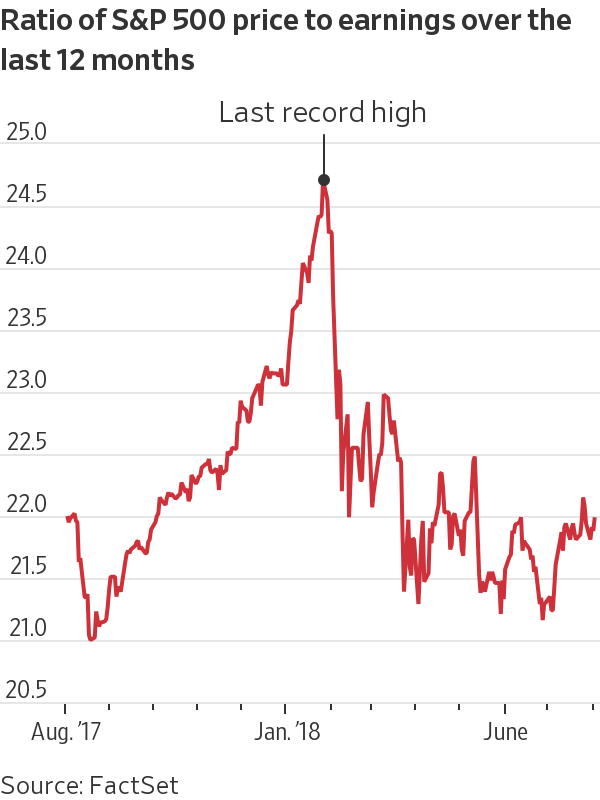
Right now, in terms of price, the S&P 500 is less than 1% away from its high-water mark set at the end of January. But take a look at what has happened to the S&P 500’s P/E during that time.
Based on trailing earnings, the S&P is currently almost three handles (or 11%) cheaper, even though prices are back up to about where they were January. This is, of course, due to robust earnings, which continue to pour in.
Right now, according to FactSet, 81% of S&P 500 firms have reported, and earnings are on track to grow 24% from year-ago levels. Not only that, revenues (the less-fudgeable earnings metric) have exceeded expectations for ALL 11 sectors of the market.
So even though prices are about back to where they were at the end of January, the market is substantially cheaper this time around.
When it comes to the US economy, let’s look at two key leading economic indicators for which we received updates last week: the ISM Manufacturing Index and the ISM Services Index.
This first chart shows the Manufacturing index, which has slipped to its lowest level in four months. Nevertheless, don’t let it concern you just yet; the latest reading came in at 58.1% (which is still considered excellent), and as you can see below, this index obviously has some month-to-month volatility. In addition, complaints from survey respondents generally attributed the decline to shortages in skilled labor and higher raw material costs – as opposed to diminished demand.
Manufacturing accounts for about 20% of U.S. GDP, with the remaining 80% of our economy revolving around services. Services have seen a minor slowdown as well.
The ISM Services index, shown below, recently fell to an 11-month low of 55.7%. This is substantially lower than the near-60% readings we saw last year but still represents solid expansion.
These two indexes rarely make their way above 60%, so in a way, you could say they are both running into “resistance” around that mark. Either way, even with pullbacks in both these readings, they still signal continued economic expansion ahead.
The preceding content was an excerpt from Dow Theory Letters. To receive their daily updates and research, click here to subscribe. Matt is also the Chief Investment Strategist at Model Investing. For more information about algorithmic based portfolio management, click here.


