With each passing day it looks increasingly likely that the February swoon was simply a run-of-the-mill correction, as opposed to the beginning of a full-fledged bear market. But that doesn’t mean we’re out of the woods just yet. Major averages may be reluctant to set new lows, but they’re also in no hurry to get back to new highs.
During periods like this, one of the best moves we can make as investors is often no move at all. Like a pilot flying through thick cloud cover, we’re better off keeping a light touch on the controls, with our eyes focused squarely on what our instrument panel is telling us.
So what’s the latest reading from our instruments?
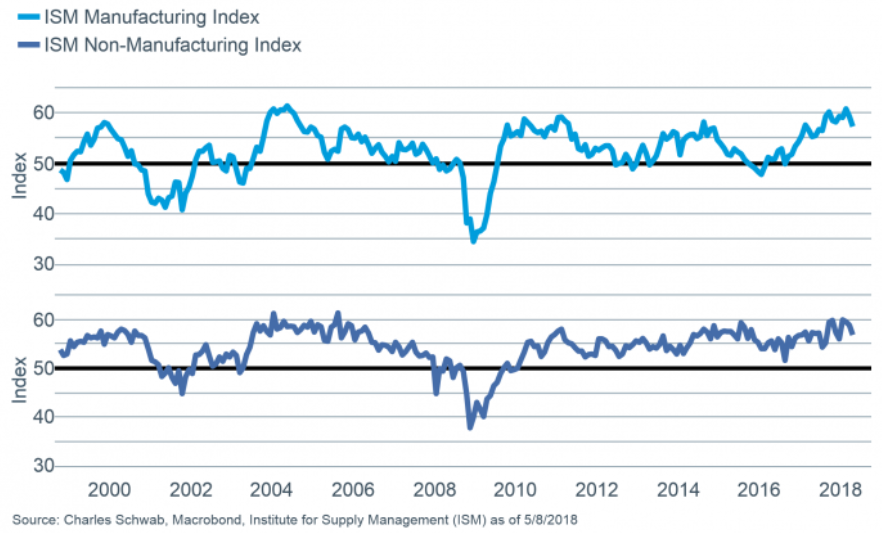
Let’s begin with a look at what manufacturing and non-manufacturing PMIs (Purchasing Managers Indexes) are telling us. In the chart below, we can see that both these leading indicators remain well above the 50 level that that denotes expansion vs. contraction.
Importantly, while these indexes may have ticked lower last month, they were both recently near levels rarely seen during economic expansions. As you can see above, both indexes recently hit the 60 mark, which has only been achieved a handful of times during the previous two decades.
The above indexes cover the U.S. only, so let’s take a look at some global composites to get a feel for the broader environment. In the chart below, courtesy of Yardeni Research, we can see that global PMIs also remain solidly in expansion mode.
Both manufacturing and non-manufacturing global PMIs took a hit early in the year, perhaps due to an escalation of trade tensions, but they moved higher again in April.
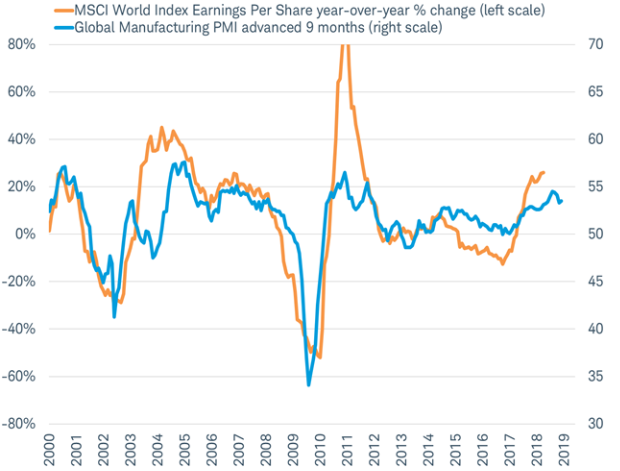
This is a positive development because the global Purchasing Managers Index is widely watched, and has been a decent indicator of the trajectory of overall global earnings.
The team over at Charles Schwab illustrates this nicely for us using the chart below. Here, the Global Manufacturing PMI is shown in blue, offset by nine months to demonstrate its leading nature. We can see earnings-per-share for the MSCI World Index in orange, and interestingly, the peaks and troughs do align quite well.
This suggests that while we may be approaching a peak in global earnings-per-share growth, there is a good chance that global corporate earnings will continue to increase throughout the end of the year and into 2019.
Does that mean we can rest a little easier? In my opinion, yes. While individual companies will compete for that growth, the big takeaway is that the global economy is continuing to expand. In other words, the pie is still getting larger.
There’s another reason that investors in U.S. markets may not have to worry too much in the short-run, and that’s because of the backstop put in place by share repurchases. As one would expect, and as suggested back in January, companies have been utilizing a good portion of their newfound cash to fund buybacks.
Corporations are notoriously bad at timing their purchase decisions (notice that the absolute peak in buybacks came during 2007 – the year the market topped out prior to the financial crisis), but still, this is a short-term positive.
When companies buy back their own shares, they generally do not resell them at a later date, meaning that supply is actually taken off the market. This drives earnings-per-share higher, which (all else being equal) leads to higher share prices.
But “all else” is almost never equal, and one change that investors have been forced to deal with is a drop in the market’s multiple. There are many factors that determine what an investor is willing to pay for worth of earnings, and one of the most important ones is the cost of money – which is highly correlated to inflation.
In the table below (also courtesy of Charles Schwab), we can see that valuation levels tend to peak when inflation is between 2-3%, and fall as inflation moves higher.
We’ve discussed this phenomenon many times, but what this boils down to is an increase in the discount rate used to price future earnings streams. As the cost of money (interest rates) rises, a dollar today becomes even more valuable than a dollar one year from now. This means that a company’s future earnings become less valuable in today’s dollars, which in turn means investors will pay a lower premium (multiple).
But please recognize that at least historically, we have not seen a major collapse in P/Es as inflation moves above 3%. In the table above, we see that the average P/E only declines by about half a point as inflation moves into the 3-4% range.
To put this in perspective, we saw the market multiple drop nearly two full points from the January peak to the correction low. This suggests that even if inflation does continue to rise in the near-term, the market multiple may not decline much further, as it's already back down near those historical norms.
Combine this with the robust earnings season that we’ve had (and are still in), and you have the recipe for somewhat stable stock prices moving forward.
Circling back to our flying analogy, even though we’re in the midst of some thick cloud cover, our instrument readings suggest there is no imminent danger. No alarms are flashing recession, and valuation levels have come back in line with historical averages. There are certainly bogeys on our radar, but until we discern more information about those possible bogeys, our best bet is to stay the course.
The preceding content was an excerpt from Dow Theory Letters. To receive their daily updates and research, click here to subscribe. Matt is also the Chief Investment Strategist at Model Investing. For more information about algorithmic based portfolio management, click here.


