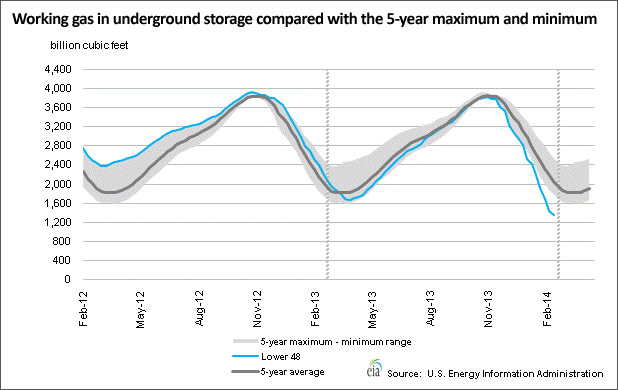
This winter has been one of the coldest on record. It’s been the coldest winter in at least 30 years, and I saw a report today that there is a chance that this will be Chicago’s coldest winter on record. Presently it is the 3rd coldest on record for Chicago, but another blast of cold air is just moving into the Midwest and East Coast.
Natural gas is a major energy source for heating homes, and prices have been spiking periodically in recent weeks as the weekly draws on natural gas inventories are higher than normal. Natural gas consumption in the US is highly seasonal, so producers use a system of underground pressurized storage that builds inventories until mid-fall, which are then depleted through the winter. Natural gas can be stored in depleted oil or gas reservoirs, in natural aquifers, or in salt caverns.
[Hear More: Joseph Dancy: Strong Economics for Natural Gas]
The US has nearly 9 trillion cubic feet (tcf) of natural gas storage capacity, but only a fraction of that has ever been used. According to the Energy Information Administration (EIA), the actual amount in storage has never exceeded 4 tcf. Inventories will usually build to between 3 and 4 tcf by ~ November 1st each year, before being pulled down to under 2 tcf by the end of winter. So a typical winter season will see just over 2 tcf pulled out of storage — an amount equivalent to about 10 percent of annual US natural gas production.
In the case of a mild winter as in 2012, inventories won’t be pulled down as much before they begin to rebuild. In fact, the winter of 2011-2012 failed to pull gas inventories below 2 tcf for the first time in over 20 years. It wasn’t a coincidence that this corresponded to natural gas prices that went below $2 per million Btu (MMBtu) the following month, and spent a full year below $4 per million Btu (MMBtu).
Presently, the exact opposite is happening. This season’s withdrawal marks the fastest inventory depletion on record during the winter months. We have already withdrawn 2.4 tcf — more than the average for most winters — and we are likely 4-6 weeks away from the bottom. If withdrawals continue at the current pace, the inventory level would reach zero the week of March 28th (see the figure below), which is usually around the time inventories start to recover. This may lead to more spiking prices in the weeks ahead, but more importantly it will probably support higher than normal natural gas prices for the rest of the year.
Gas in underground storage is on a trajectory to hit the lowest inventory on record
Regardless of what happens over the next 6 weeks, natural gas inventories will probably bottom out at the lowest level on record. The current lowest inventory level on record took place on April 11, 2003 at 642 billion cubic feet (bcf).
Natural gas in underground storage hasn’t dropped below 1 tcf since 2003, but the latest EIA report showed inventories on February 14th at 1.4 tcf and falling at a weekly rate of 245 bcf per week (average rate of decline over the past month). At that rate, we will go below 1 tcf of gas in underground storage this week, but the EIA won’t report that number until late next week.
Obviously you could have extrapolated any of those previous years to zero, but the point is that inventories generally start to rebuild after March 28th. Extrapolating previous years would have interested with zero around mid to late April, after injection season has resumed. The following graphic makes it a bit more obvious that this year’s decline is historically abnormal:
The media hasn’t spent much time covering this issue, but I expect it will garner some attention if we drop below 1 tcf next week since it hasn’t happened in over a decade. This would put the US about one more cold snap from sending natural gas prices to the moon.
Natural gas prices have been falling in recent days, but I think that sell-off is premature. I predict that we will drop below the previous all-time low of 642 bcf from 2003. If the weather warms up soon we may be able to avoid it, but it looks increasingly likely to me.


