Summary
- Investors have shifted towards higher quality assets.
- This dynamic is present in the latter innings of a bull market.
- Of concern is a significant loss in market momentum.
- Greater emphasis on risk management is required.
Was it all just a bad dream? Had you closed your eyes a month ago you would have seen the S&P 500 hovering between 1980-1990; fast forward a month ahead and we have the S&P 500 essentially unchanged. Monthly closing values are often the only thing investors look at on their monthly statements and they would have had no idea what a truly volatile month it was. From a peak of 2019.26 on 09/19/14, the S&P 500 fell to a low of 1820.66 on 10/15/14, a decline of nearly 200 points with the Dow Jones Industrial Average falling by nearly 1500 points during the same time.
The wild price swings were not confined to the stock market as the 10-Yr UST yield slid from a September high of 2.65% to a low of 1.86% on October 15th. While the move in the stock market garnered most of the financial media’s attention during the recent decline the movements in the bond market were even wilder. The Volatility Index (VIX) for the stock market is a measure of volatility for the S&P 500. There is also a measure of volatility for the bond market, which is the Merrill Lynch Option Volatility Estimate Index (MOVE). As seen below, while volatility on the VIX spiked close to $30, the MOVE Index briefly inched above 100 and was close to the volatility we saw with the “taper tantrum” of 2013.
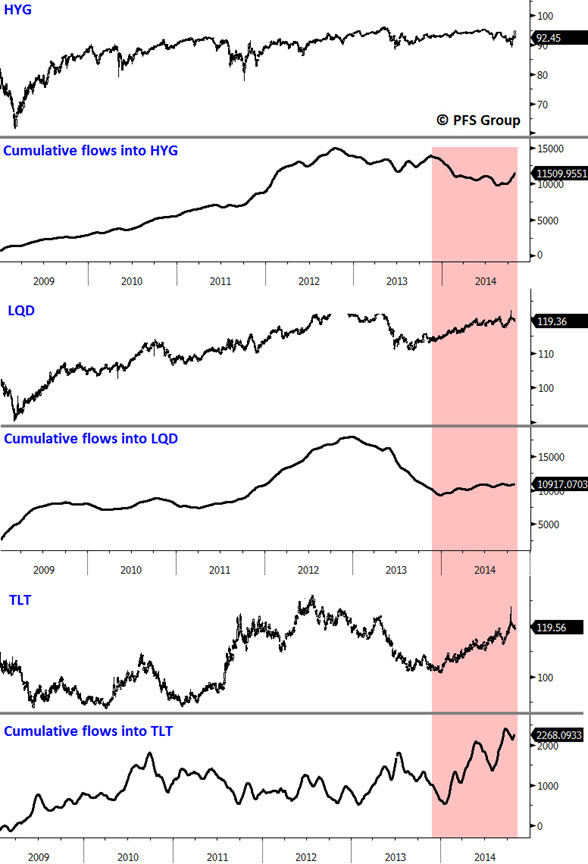
Looking further into the bond market we saw large outflows from high yield ETFs like iShares iBoxx High Yield Corporate Bond ETF (HYG) and the SPRD Barclays High Yield Bond ETF (JNK). Both funds saw a continued sea of investor capital chasing yield from 2009 through 2013, with steady declines since. Investors began to move up the quality spectrum by selling junk bonds and pouring money into investment grade bonds like the iShares iBoxx Investment Grade Corp. Bond ETF (LQD) and into government bonds like the iShares 20+ Year Treasury Bond ETF (TLT). This can be seen in the image below where the red shaded box shows outflows from HYG coinciding with inflows into LQD and TLT.
We’ve seen a similar dynamic of shifting up the quality spectrum in the equity markets that coincides with the fixed income quality shift. Late 2012 to early 2013 was all about chasing risk and increasing market beta and investors did this by increasing their allocation to small cap stocks like the Russell 2000 ETF (IWM) at the expense of megacap stock allocations like the iShares S&P 100 (OEF)—the largest 100 stocks in the S&P 500. This however changed in early 2013 as inflows into IWM peaked while inflows into OEF began to increase.
Near the end of an economic cycle and bull market, investors begin to pay more attention to valuation and risk and we typically see a shift into higher quality assets. We saw this beginning in 2006 as the iShares S&P 100 (OEF) saw a huge surge in inflows relative to 2003-2005, with inflows seeing an increase even after the market peaked.
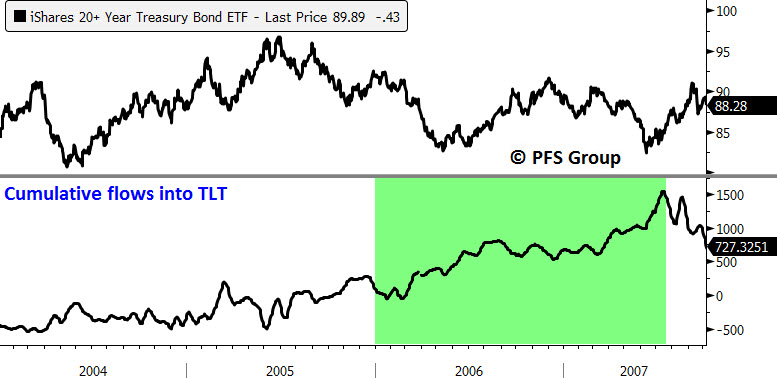
Not only were investors increasing their allocation to large blue-chip megacap stocks like those in the S&P 100 but they were also beginning to cut their overall equity exposure while increasing their bond exposure. Beginning in 2006, inflows into long bond ETFs like TLT saw increasing inflows as the market began to form a top.
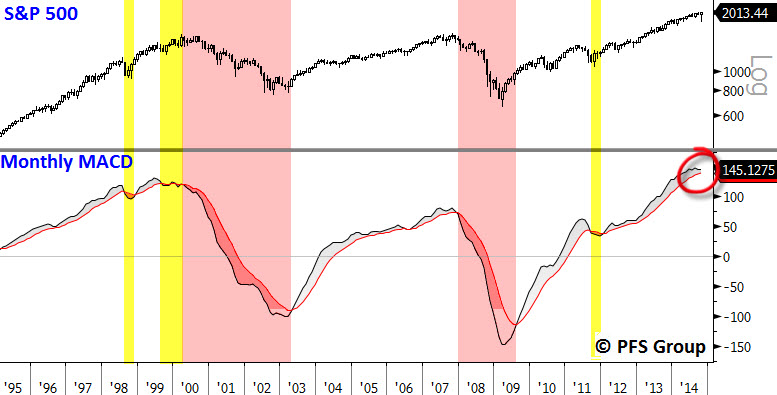
What the shift to quality means is that we are likely moving into the final stage of the bull market and economic expansion. How long this late-stage market and economic cycle can go on for is anyone’s guess, particularly with central bank intervention; but what it ultimately implies is a greater focus on risk management and lowering one’s risk in the markets. There are some simple tools that can help investors to filter out the noise and avoid large downturns in the market, and my favorite tool for spotting bull and bear markets is the monthly MACD signal. I use the simple rule of thumb that the markets are in a bull market as long as the S&P 500 is on a monthly MACD buy signal and in a bear market when we are on a sell signal. There are a few whipsaws here and there like the 1998 LTCM crisis and the 2011 US debt downgrade (yellow bars below), but while nothing is perfect the key is staying out of the bulk of bear markets.
Looking at the S&P 500 over the last two decades shows that respecting a monthly sell signal would have helped investors avoid the bulk of the devastating 2000-2003 technology crash or the 2007-2009 financial crisis and Great Recession. What needs to be watched ahead is the narrowing in the MACD lines where we could have a potential cross in the months ahead to give our first sell signal since 2011.
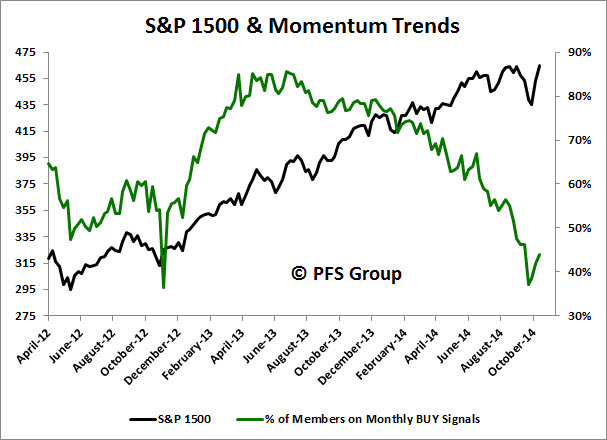
What has me concerned is the loss in momentum in the markets. Momentum ALWAYS peaks before the market peaks and the fact that the bulk of monthly MACDs for the S&P 1500 (inclusive of the S&P 600, 400, and 500) are on sell signals (56%) presents a concern. Momentum is now near the lows of the last two and a half years and highlights the deterioration we've seen in market internals since 2013 when nearly 90% of all 1500 members in the S&P 1500 were on monthly buy signals.
Summary
We’ve seen some pretty wild swings in the market lately but what is more important than the swings is the shifting flow of money from lower quality to higher assets. This is a hallmark for aging bull markets and was exactly the same condition we saw leading up to the 2000 and 2007 tops. Tops are a process and there is no set time table for how long this late-stage phase of the bull market will continue given global central bank intervention (just look at the BOJ announcement today). What is more important than trying to spot a top is to begin focusing more on risk management as risks are always greatest near the end of a cycle, and to shift more towards higher quality assets.


