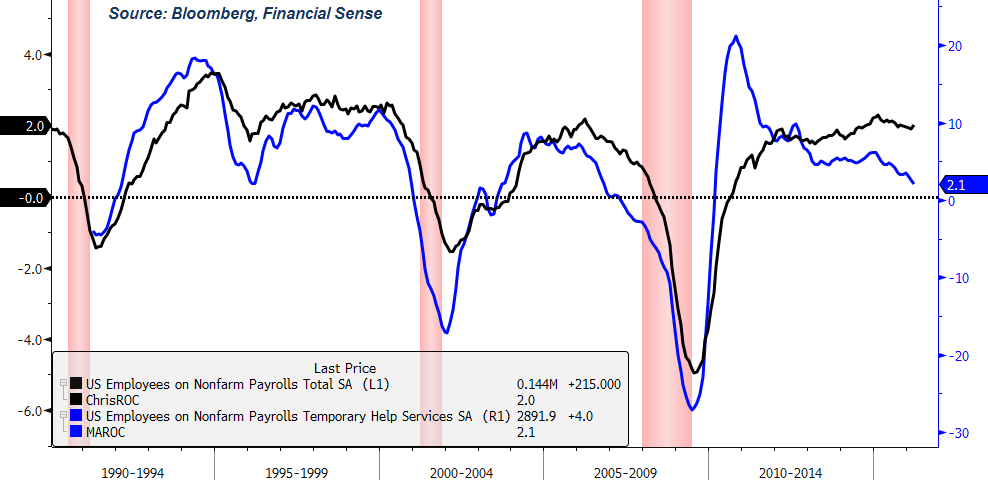
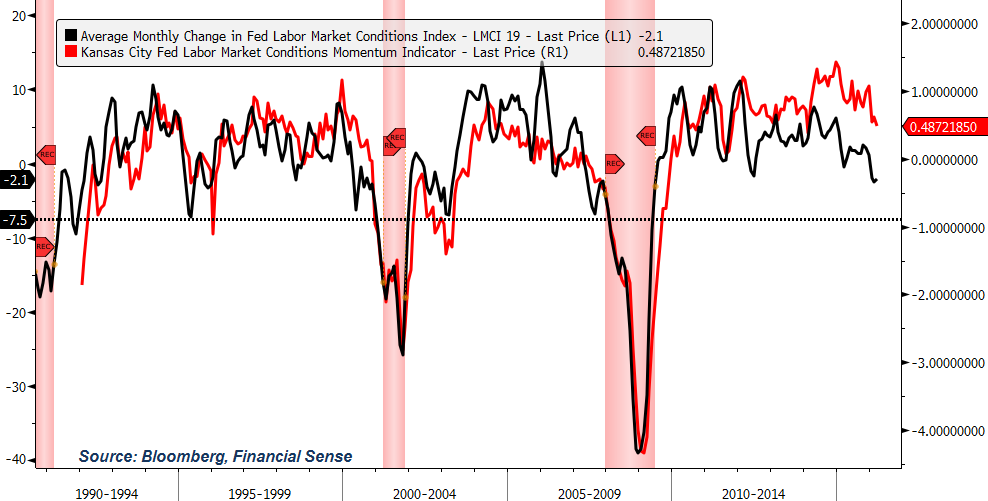
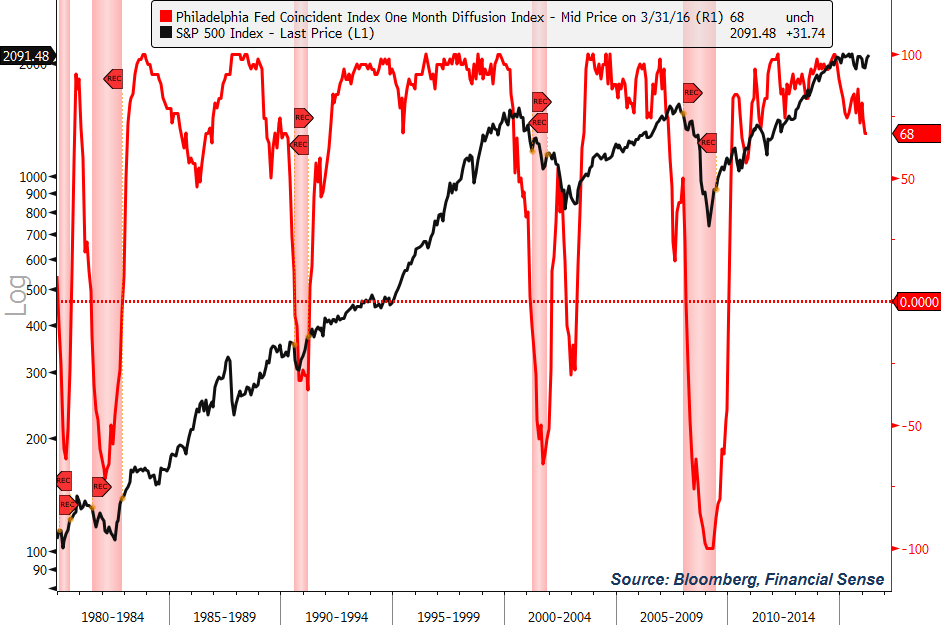
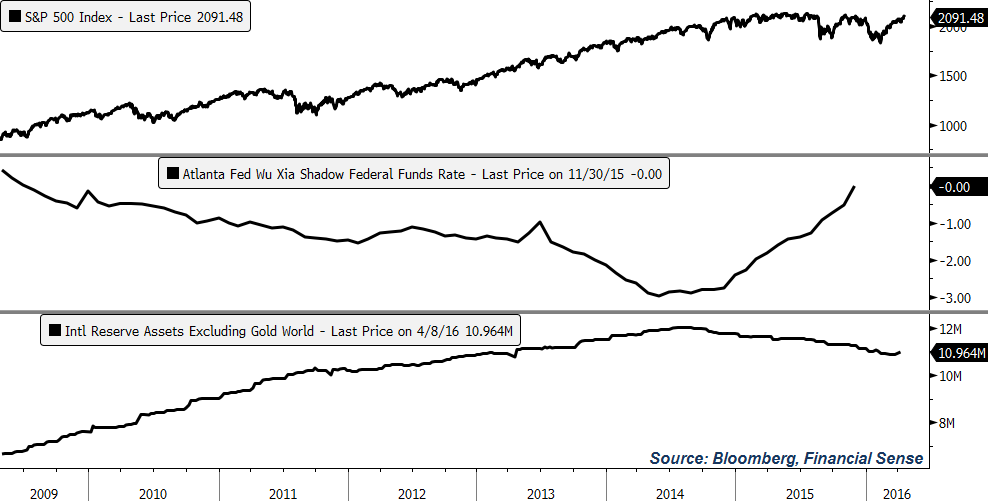
In Wednesday's podcast, Chris Puplava provides a comprehensive update on PFS Group's economic outlook for the US by explaining the message coming from each of the 15 charts below.
Many of these forward-looking indicators are regularly discussed in our weekly broadcasts and comprise the core pillars of our analysis and forecasts. They were also used as evidence in Puplava's many warnings during the 2007 market peak (see samples below) that major downside risks had materialized for the US economy and stock market.
August 22, 2007: Proceed With Caution
August 29, 2007: Credit Erosion: The Worst Is Yet To Come
September 5, 2007: Will Financials Be to This Bull Market...What Tech Was to the Last?
December 5, 2007: Survey Says: Watch Out Below!
An increasing number of these same indicators, which flashed a warning sign at prior market tops, are starting to signal caution once again.
In reviewing the data below, Puplava says, absent a major turnaround or injection of stimulus, the odds are increasing for a US recession in 2017 and a possible peak in the stock market this year.
Here are the charts discussed on Wednesday's podcast. (Subscribers can access the full audio on our Newshour page or via podcast app on their mobile device. Not a subscriber? Click here.)
Strongest Sectors of the Economy Starting to Slow Down
Labor Market Weakness
Leading Economic Indicators (LEIs) Falling
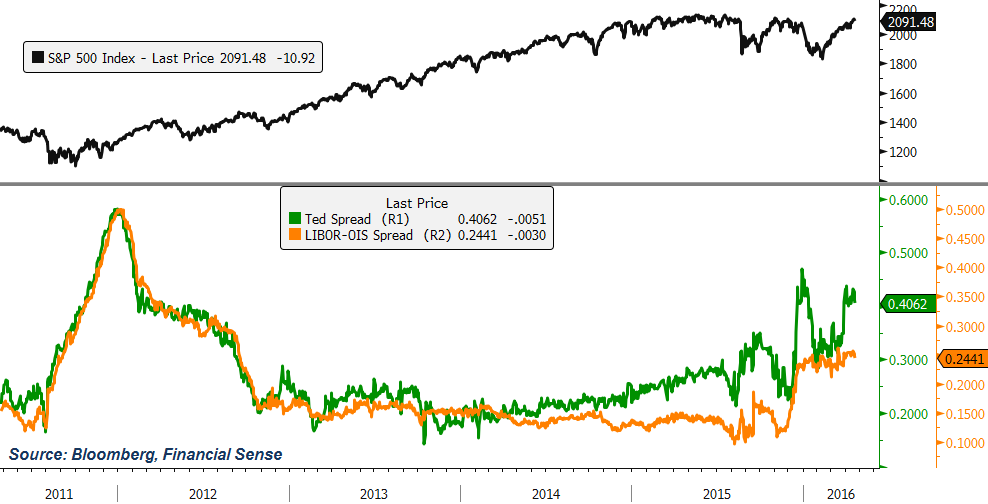
Liquidity Still a Problem
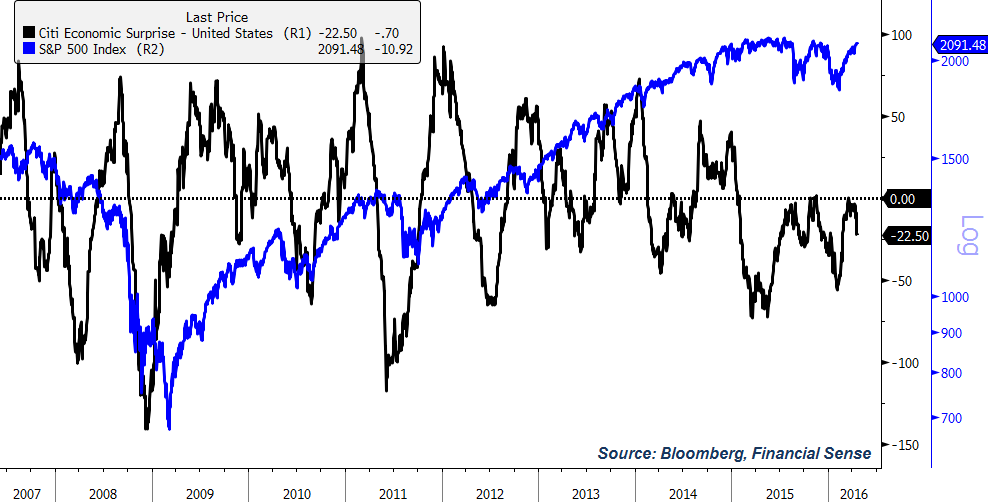
Prolonged Economic Misses
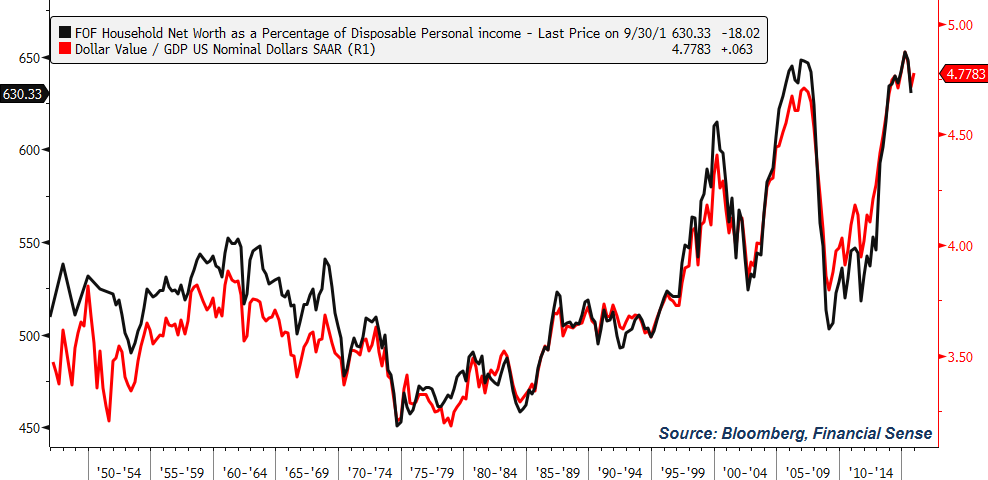
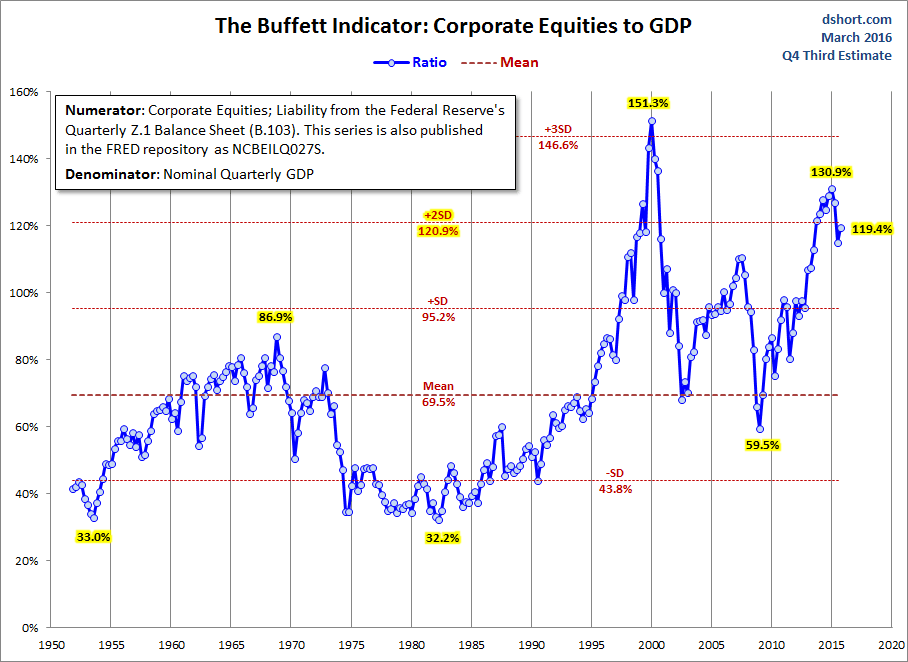
Wall Street vs. Main Street – Valuation Concerns
Listen to this full 40-minute podcast interview with Chris Puplava, Chief Investment Officer at PFS Group, airing Wednesday by logging in and clicking here. Not a subscriber? Click here.


