


To say there’s been some blood spilled in the energy pits is an understatement. Since the start of the month, the S&P energy sector is down nearly 16% while the financial sector is up nearly 7.5%, quite the pair trade during the month of July. A little less beaten down is the material sector, though the energy sector by far has taken the biggest beating, a swift and vicious one at that.
Figure 1
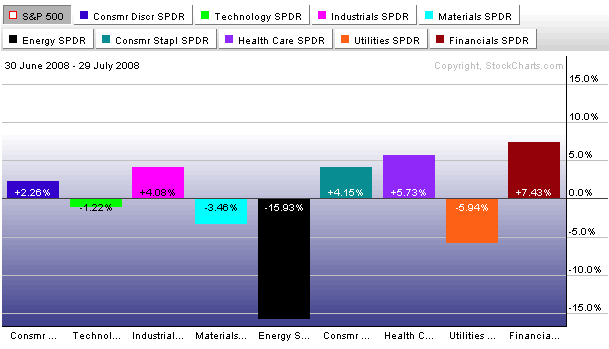
Source: StockCharts.com
Today’s article will highlight both technically and fundamentally that the sell-off in energy shares is overdone and nicely compliments the technical work done in yesterday’s WrapUp by Frank Barbera, Assessing the Calm, in which Frank comments on the crude oil sell-off. Frank is calling for a bottoming range in the 0 to 6 zone for crude, or roughly 5% to 10% below yesterday’s close.
Been There, Done That
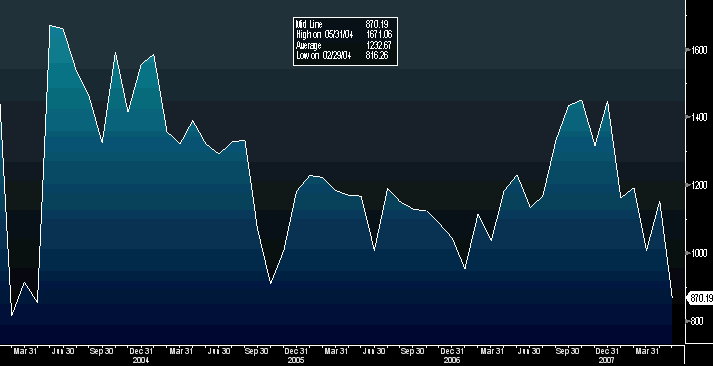
The significant run-up in energy shares off the May lows in June was most certainly a bit extended as most energy shares were fairly overbought and a correction was to be expected. The carnage that fell out was swift and sharp, but not extraordinary as far as energy shares go. For example, there have been nine double-digit corrections in the Amex Oil Index (XOI) since the start of 2005, with the current correction marking the second 20%+ correction (2007 correction nearly marked a third) in the past three and a half years. However, the end of the correction is likely at hand as energy shares are deeply oversold.
Figure 2

Source: StockCharts.com
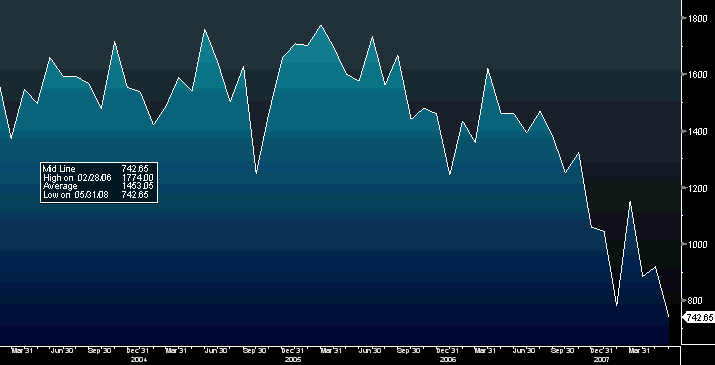
Looking at the bullish percent index for the S&P Energy Sector, which is calculated as the percentage of stocks showing the bullish point and figure buy signals, shows that energy shares are deeply oversold as only 15% of the S&P 500 energy shares were flashing buy signals in the last few days. Dips below 20% have been buying opportunities as the chart below highlights, while levels above 80% are typically the areas for tops with the recent peak in May rising north of 90%. Buying the dips when energy shares are tossed to the sharks has been a successful strategy, a strategy advised by a famous banker.
“Buy when there’s blood in the streets”
~Baron Rothschild
Figure 3

Source: StockCharts.com
Not only does the bullish percentile index for energy point towards a bottom, but so too does the seasonality of the Amex Oil Index which is closely tracking its pattern from last year and is likely tracing out a bottom as it did last August.
Figure 4

Source: Bloomberg.com
While Frank is still calling for another 5% to 10% correction in crude, oil stocks are likely to trade sideways as energy shares have led oil in both the upside and downside and can trade higher despite oil moving lower (or sideways) as they did back in March as the following figure illustrates.
Figure 5

Source: StockCharts.com
Fundamental Appeal for Energy Shares
The fundamental analysis presented below builds upon a previous Observation (Energy Bull Market Fundamentals Remain Strong) in which there still remains a strong case for owning energy shares. An update of one of the figures presented in the April WrapUp is presented below that shows the picture for energy shares has only improved in the last few months. Back in April, the inflation rate for oil field and gas field machinery was 8.0% after bottoming at 4.5% in January, supporting the rise in the shares of the oil service sector whose pricing power was rising unlike most sectors of the economy. Since then oil service sector pricing power has increased further with the inflation rate now rising to 10%, this despite rig counts breaking to new highs this cycle as oil companies use their rising cash flow to increase production through the drill bit.
Figure 6
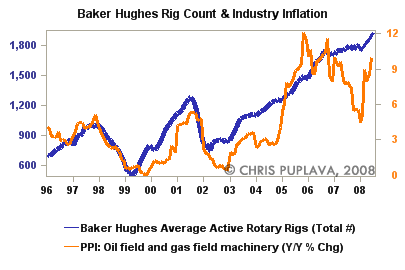
Source: BLS/Baker Hughes Incorporated
Though pricing power has improved in the oil service sector and oil and gas prices are still high, the concern weighing on the energy market is demand destruction as the yearly change in vehicle miles driven in the U.S. has turned negative for the third time in nearly forty years, with the previous two caused by the oil crisis’s in the 1970s.
Figure 7
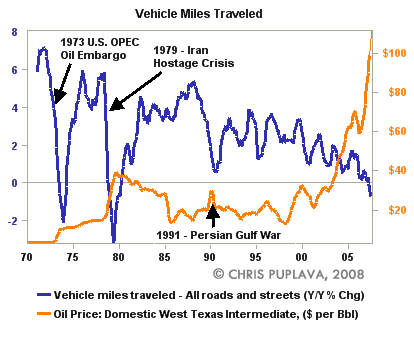
Source: DOT/Federal Reserve Bank of St. Louis
Despite weakening demand, crude oil inventory levels are falling, not rising, and are 13.7% below year-ago levels. This is the result of negligible growth in U.S. production of crude oil while imports are falling on a year-over-year (YOY) basis with import growth levels at their lowest rate in over six years.
Figure 8
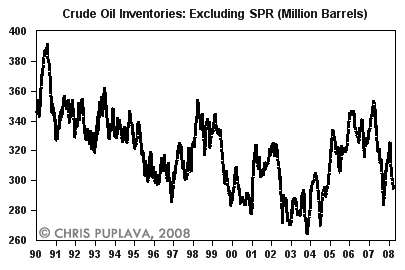
Source: EIA
Figure 9

Source: DOE
Figure 10

Source: EIA
Part of the cause for falling oil imports in the U.S. stems from falling production from mature oil fields as well as falling exports. Canada, Mexico, and Venezuela combined make up over 42% of total exports to the U.S. as of May of this year, and each has shown a dramatic decline in exports to the U.S. For example, Canadian exports (20.7% of total U.S. imports) have fallen 26% since their high in November of 2006 and a more dramatic decline is seen in Venezuelan exports to the U.S. (11.7% of total imports), which have fallen 48% since their peak in May of 2004. The likely cause of the Venezuelan drop is Hugo Chavez shifting his country’s exports to China as Mr. Chavez is no fan of the “imperialist U.S.” Even more dramatic than the decline in exports from Venezuela is the decline in imports coming from Mexico (9.98% of total imports), which are down 58% since their peak back in February of 2006 as the giant Cantrell oil field’s decline rate accelerates.
Figure 11. Canadian Exports to U.S. (Ths. Barrels)

Source: Bloomberg.com/DOE
Figure 12. Venezuelan Exports to U.S. (Ths. Barrels)
Source: Bloomberg.com/DOE
Figure 13. Mexican Exports to U.S. (Ths. Barrels)
Source: Bloomberg.com/DOE
The drop off in exports to the U.S. from its southern and northern neighbors appears to be continuing the trend which was commented upon back in April of last year (Crude Reality: Dependent and Deprived). While imports have risen from the Middle East, they have not been enough to make up for the shortfall from the Americas. The monthly change in imports in May of this year by region is shown below, as well as the percent of total imports. The decline in the Americas is due to declining oil fields and political reasons (Chavez dislike for the U.S./President Bush), while the decline from Africa comes from geopolitical turmoil, chief of which is Nigeria.
Table 1. U.S. Imports by Region (05/31/08)
Source: Bloomberg.com/DOE
Don’t Count on OPEC
The U.S. isn’t alone in facing the problem of falling imports as oil demand in oil exporting countries is cutting into the level of their exports as Jeff Rubin (click for a history of his excellent calls and his bio), Managing Director of CIBC World Markets, and Peter Buchanan highlight below in their recent report.
OPEC: Solution or Part of the Problem?
Shady speculators. The sagging dollar. Global tensions. The only factor that OPEC’s leaders don’t blame for triple-digit oil prices is their own energy subsidies, that are fuelling runaway demand, and cannibalizing their oil and gas exports. That includes not only ultra-low prices for products like gasoline (see Occasional Report #62, “OPEC’s Growing Call on Itself”)—for which motorists typically pay a tenth or so the prevailing global rate— but even more egregious subsidies for oil- and gas-fired electricity.
Alongside impressive GDP growth, subsidies for a range of fuel types—including fossil fuel-fired electricity—are serving to boost petroleum demand in the Middle East, limiting the region’s exports and threatening to tighten global markets even further. Half of the world’s population pays less than the prevailing market rate for oil products, a key reason why triple-digit world oil prices have yet to quash global demand. Nowhere are users more shielded from those prices than in major oil-producing countries in the Middle East itself.
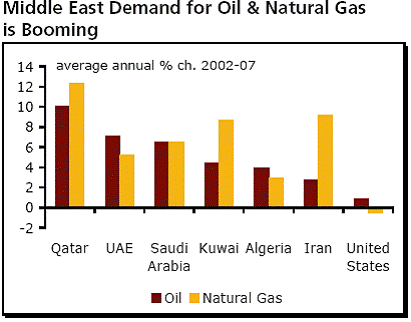
Mr. Rubin points out that crude exports from the Middle East fell by over 700,000 barrels per day in 2007, with rising demand as the chief culprit. The growth in demand from the Middle East is not limited to oil alone, as Mr. Rubin notes that near double-digit growth was seen in many Middle East countries for natural gas as well.
Figure 14

Source: CIBC World Markets
Figure 15
Source: CIBC World Markets
Figure 16
Source: CIBC World Markets
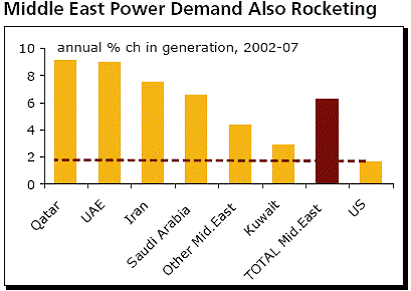
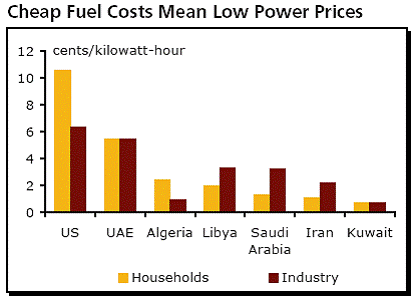
A large part of the reason for the rising demand from the Middle East is that energy prices are largely subsidized, which allows for demand to grow despite world energy prices rising to nearly 0 per barrel last month. For example, Mr. Rubin points out that Saudi motorists are paying 45 cents a gallon, which translates to roughly a barrel of oil, with Saudi Arabian power plants paying only __spamspan_img_placeholder__.46 per million Btu, or roughly a barrel.
Figure 17

Source: CIBC World Markets
Figure 18
Source: CIBC World Markets
Not only are cheap oil subsidies driving up energy demand in the Middle East, but so too is rising demand from desalination plants with the production of fresh water from salt water being a highly energy-intensive process. Mr. Rubin cites a World Bank study that estimates the Middle East will need an extra 50-60 billion cubic feet of water annually over the next 10-15 years to meet rising demand. Mr. Rubin calculates that the desalinization of water on the scale called for by the World Bank could lead to the use of one million barrels of oil per day, which would drastically cut Saudi Arabia’s export volumes.
Figure 19

Source: CIBC World Markets
Mr. Rubin’s report paints a very bleak picture in terms of oil demand stemming from desalinization as well general high economic demand due to energy subsidies. To summarize the report in Mr. Rubin’s own words: “If world oil markets are to see future supply growth, it won’t be coming from OPEC.”
Figure 20

Source: CIBC World Markets
Investment Appeal for Energy Shares
Not only does the technical and fundamental picture support a bullish outlook for energy shares, but so too does the investment appeal stemming from the sector’s earnings power. For example, which would you rather own — an investment yielding 4.04% or 11.1%? That’s the difference between the yield on the 10-Yr UST versus the average earnings yield (earnings divided by price, the inverse of the P/E ratio) for the S&P 500 Energy sector. Backing out inflation, with headline CPI showing a 4.90% inflation rate produces a NEGATIVE real return for the 10-Yr UST of -0.86%, an event marking the fourth time in more than a half-century where investors were losing money by holding U.S. Treasuries.
Figure 21

Source: BLS/Federal Reserve
With negative real yields, it’s not surprising to see investment managers arguing against owing U.S. Treasuries, not the least of which is Bill Gross, Managing Director for the world's largest Bond Fond (PIMCO) who had the following to say.
With global headline inflation now at 7% there is a need for new global investment solutions, a role that PIMCO is more than willing (and able) to provide. In this role we would suggest: 1) Treasury bonds are obviously not to be favored because of their negative (unreal) real yields. 2) U.S. TIPS, while affording headline CPI protection, risk the delusion of an artificially low inflation number as well. 3) On the other hand, commodity-based assets as well as foreign equities whose P/Es are better grounded with local CPI and nominal bond yield comparisons should be excellent candidates. 4) These assets should in turn be denominated in currencies that demonstrate authentic real growth and inflation rates, that while high, at least are credible. 5) Developing, BRIC-like economies are obvious choices for investment dollars.
Bill Gross
Investment Outlook June 2008: Hmmmmm?
Commodity-based assets, as recommended by Mr. Gross, most certainly have greater appeal than the real returns offered from U.S. Treasuries. As stated above, the average earnings yield for the S&P 500 Energy sector is 11.1%, with six energy stocks sporting earnings yields north of 15%, with the average stock showing a return on equity (ROE) north of 20%. The complete list of the S&P 500 Energy stocks is listed below.
Table 2. S&P 500 Energy Sector
Source: Bloomberg.com
* Bloomberg mean analyst estimate
Not only do energy shares show a greater investment appeal than U.S. Treasuries, but they also show the highest current earnings yield (E/P) of the ten S&P 500 sectors, with two sectors showing a negative price to earnings ratio and negative earnings yield.
Table 3. S&P 500 Sector Price-to-Earnings Ratio & Earnings Yield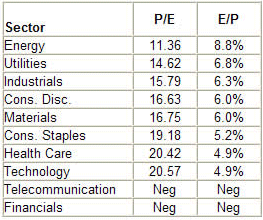
Source: Bloomberg.com
Likely confirming the analysis above is the dramatic showing in the energy shares with one of the biggest daily gains today of the year as the Amex Oil Index (XOI) rose 5.83%, the Amex Natural Gas Index (XNG) was up 4.62%, and the Amex Oil Services Holders (OIH) rose 5.74%. It’s not surprising to see investors swooping in to pick up energy shares as the technical sell-off was overdone, the fundamental picture remains strong, and energy shares are heads above their peers as well as other asset classes in terms of investment appeal. Though the rally in energy shares is warranted, some of the current buying in the shares is likely due to short covering, much like we’ve seen in the oversold rallies in financial shares. In any event, falling production and exports in the face of rising demand from developing nations are likely to carry energy shares higher once more, giving the endless energy bubble callers yet another chance at calling a top.
Figure 22

Source: StockCharts.com
Perhaps more productive for financial talking heads than calling for a top in energy would be to actually DO SOME RESEARCH instead of simply looking at the price of oil! Look at production decline rates, export rates, demand growth, at least something other than a moving numerical value placed on the price of oil or looking for culprits like the evil “speculators.” If doing some actual research is too painstakingly difficult, I’ll throw all the energy bubbleheads a bone. Click below for an hour-long discussion on energy from three top experts, Matthew Simmons, Dr. Robert Hirsh, and Jeff Rubin, as well as a detailed report written on energy by Jim Puplava in March of 2007.
FSN Expert Roundtable (02/02/08)
Powershift oil, money & war™ - PART 2: EYES WIDE SHUT: The Politics of Energy


