It's true that equities fall before the start of most recessions. So why bother following the economy; why not just follow the price of equities?
"Market corrections" occur every 20 months, but less than a third of these actually becomes a bear market. Recessions almost always lead to bear markets, and bear markets outside of recessions are uncommon. For that reason, discerning whether a recession is imminent can help determine when an innocuous correction is probably the start of a sinister bear market. Volatile equity prices alone are not sufficient.
The future is inherently unknowable. We can never say with certainty what will happen in the months ahead. But the odds suggest an imminent recession in the US is unlikely at present and, barring a rogue event like 1987, a bear market is not currently underway. That means equities are most likely on their way to new highs in the coming months.
You may also like Mindless Robots Have Taken Over the Markets, Says Don Coxe
Why bother following the economy? Why not just follow the price of equities?
It's true that equities fall before the start of most recessions. Take the last 50 years as an example. There have been 7 recessions and the S&P has peaked and started to fall ahead of all except one (the S&P peaked with the start of the recession in 1990). On average, the S&P has provided a 7-month "heads up" that a recession is on the way. That's enough for even the slowest investor to get out of the way. Enlarge any chart by clicking on it.
But there's a basic problem with this approach. Only in hindsight do we know that an equity peak has signaled an oncoming recession. Most of the time, equity drops have signaled nothing.
Since 1950, there have been 35 "corrections", where the S&P has fallen at least 10%. Just 10 of these have gone on to become a bear market (defined as a fall of 20%, in red text in the table below; see note at bottom of this post; table from Yardeni, here).
Market corrections feel devastating in real-time, but the reality is they occur every 20 months on average (since 1980). Annual falls of greater than 10% are a basic feature of the stock market, but each one feels like the start of a bear market.
The eminent economist Paul Samuelson put his finger on the problem when he quipped that "the stock market has forecast nine of the last five recessions" (a 56% success rate). Actually, he was being polite: since 1950, the stock market has forecast 35 of the last 10 recessions (a 28% success rate).
Of the 10 recessions since 1950 (here), a bear market has materialized in 9 (1953-54 is the borderline exception). Because recessions almost always lead to bear markets, having a good guess at whether a recession is imminent is critical to understanding whether an innocuous correction will lead to a sinister bear market. Volatile equity prices alone are not sufficient (chart from Yardeni, here).
In the past 50 years, three economic indicators have warned of a recession: rising unemployment claims, an inverted yield curve, and declining new home sales. On average, all of these signaled trouble ahead of a peak in the S&P. They lead price.
That means that if these economic indicators have signaled a rising probability of a recession, the next fall in equity prices is unlikely to be just a correction but a bear market.
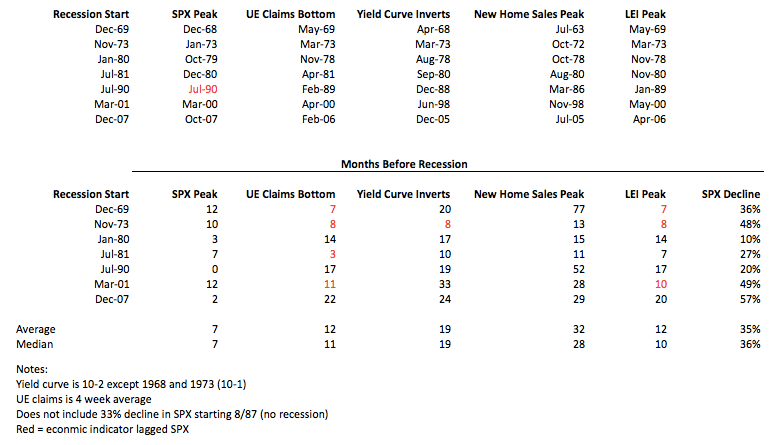
The tables below show every recession in the past 50 years. In the top table, each recession date is shown together with the dates when the SPX peaked and the three economic indicators have signaled a warning. The bottom table calculates the months ahead of the recession for each of these.
What we see is:
On average, the SPX has peaked 7 months ahead of the next recession.
Unemployment claims have started to rise a median of 11 months before the next recession, but it has lagged the SPX four times (in red).
The yield curve has inverted an average of 19 months before the next recession; it has lagged the SPX just once.
New home sales have started to decline from a peak more than 2 years ahead of the next recession; it has never lagged the SPX.
The Conference Board's Leading Economic Indicator (LEI) Index includes the indicators above plus equity prices, ISM new orders, manufacturing hours and consumer confidence. Its final peak has been a median of 10 months before the next recession.
So, did equities peak in January and are we now headed for a recession and a bear market?
Probably not. Unemployment claims hit a 49 year low in mid-May; the yield curve is still 50 bp away from inversion; new home sales are close to (but below) their expansion high made 5 months ago, and the LEI made a new high in April. All of this implies that the SPX is likely to exceed it's January high in the months ahead (chart from Doug Short).
It's true that bear markets happen outside of recessions, but these are unusual. In the past 70 years, 1962, 1966 and 1987 are the sole exceptions.
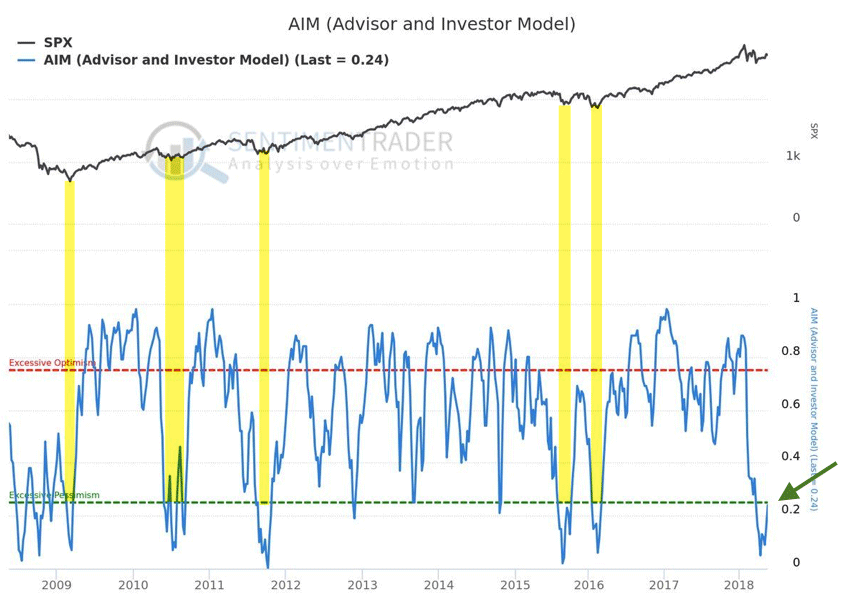
That's why 1987 is always brought up as a bearish analogy for what lies ahead - it's the only bear market outside of a recession in the past 50 years (read about all the times "today is just like 1987" here). But the 1987 bear market occurred after SPX rose nearly 50% during the prior 10 months; it was a euphoric blow-off top. In comparison, investors' sentiment today is relatively dour (from Sentimentrader; to become a subscriber, click here).
The 1966 bear market occurred when the Federal Funds Rates rapidly rose from 4% to 6%. Inflation went from less than 1% to 3.5%. Investors were surprised and caught flat-footed. In comparison, the FOMC has been deliberately slow at raising rates this cycle, and it has very clearly communicated its intentions to the market. A repeat of this policy mistake seems improbable.
Bearish pundits have been wrong about threats from QE, the Fed's "balance sheet" and global central banks to the equity bull market for many years. A detailed rundown of this is here.
The future is inherently unknowable. We can never say with certainty what will happen in the months ahead. Surprises are always possible. But the odds suggest an imminent recession in the US is unlikely at present and, barring a rogue event like 1987, a bear market is not currently underway. That means equities are most likely on their way to new highs in the coming months.
For a regular update on the economy, follow our monthly post with the latest data here.
Notes
Recession and bear market data can be sliced several ways. We've tried to avoid controversy by choosing the most commonly accepted definitions and dates, as follows:
1. The most commonly accepted definition of a bear market is a loss of more than 20% in the S&P. Yes, 20% is an arbitrary number but so are 15% and 25%. For better or worse, 20% is the accepted benchmark.
2. Of the 10 bear markets listed above, 7 occurred together with a recession (1962, 1966 and 1987 are exceptions). A bear market outside of a recession is unusual.
3. 9 of the last 10 recessions led to bear markets. The exception is the 1953-54 recession, although it's debatable; the S&P fell 15% during that time with the correction lasting 252 days, one of the longest on this list.
4. We have included the 19.9% fall during the 1990-91 recession as among the bear markets.
5. The 1959-62 period is very convoluted. A very long (422 days) 14% correction started in August 1959. Then came a recession starting in April 1960 and ending in February 1961. A very short (14 month) bull market started with Kennedy's election in 1960, followed by a 28% bear market later in 1961 and into 1962, beginning a few months after the recession had technically ended. This messy period is not included as a recession/bear market but it easily could be.
6. The recessions of 1980 and 1981-82 are considered separate. If you were walking around at the time, it felt like one continuous recession.


