The current level of the federal funds rate is 1.92%. As of June 13, 2018, the median estimate of Federal Open Market Committee (FOMC) members of the appropriate federal funds rate by the end of 2081 was 2.40%. This implies that the Federal Reserve has “penciled in” two more 25 basis point increases by the end of this year. If, in fact, the Fed holds this rate-increase course, I believe a recession will occur sometime in 2019. How do I know? The yield curve tells me so.
Cast your eyes on Chart 1, which shows you the behavior of the quarterly average percentage point spread between the yields on a 10-year Treasury security and 1-year Treasury security from January 1955 through June 2018. The shaded areas in Chart 1 represent periods of recession. Notice that every recession starting with the 1957-58 recession was preceded by a narrowing in this yield spread to a degree that the value of the spread went negative. That is every recession starting with the 1957-58 one was preceded by a negative spread between the yield on the Treasury 10-year security and the Treasury 1-year security. During the January 1955 through June 2018 period, there was only one occasion when this negative yield spread gave an incorrect recession signal. That was from December 1965 through February 1967. During this period, the pace of real economic activity slowed sharply, but not sharply enough or long enough to result in being designated a recession by the arbiters of such, the National Bureau of Economic Research. To wit, in the four quarters ended Q2:1967, real GDP grew by 2.6%, down from 7.5% in the four quarters ended Q2:1966. As economic growth weakened, the Fed shepherded the federal funds rate down from 5.75% in December 1966 to 3.50% by June 1967, thus pulling the economy out of its nosedive. As of July 13, 2018, this yield spread stood at 0.48 percentage points. If the Fed were to hike the funds rate another 0.50 percentage points by yearend, the yield on the Treasury 1-year security was to rise by the same amount and the yield on the Treasury 10-year security was to remain the same, the Treasury 10-year – 1-year yield spread would move into negative territory.
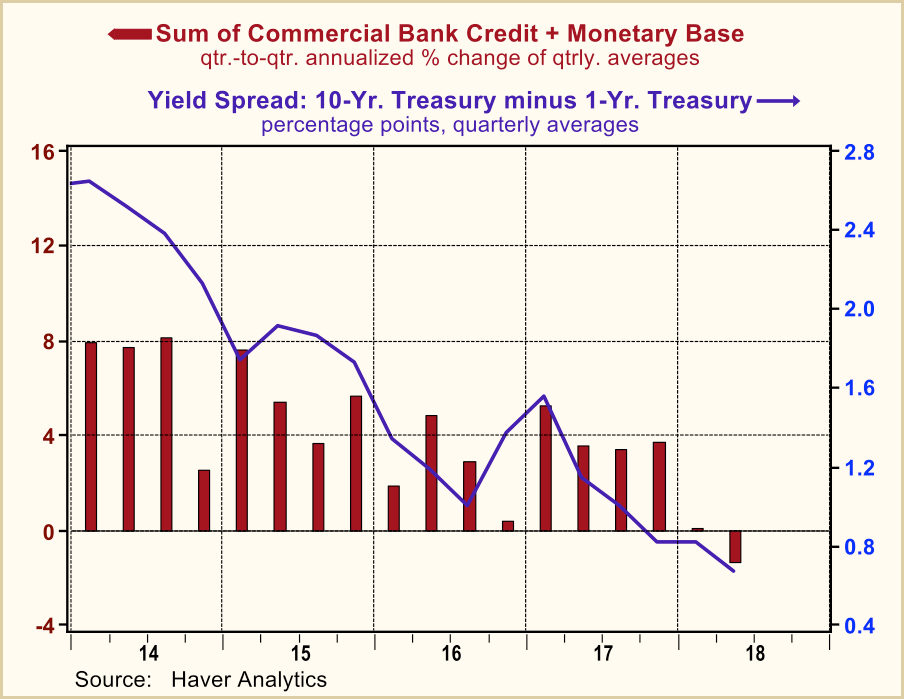
The seminal and best research on the yield spread as an indicator of monetary policy and as a predictor of recessions was done by the Nikola Tesla of monetary economics, the deeply missed Robert D. Laurent. The logic behind the yield spread as an indicator of the degree of restrictiveness or accommodation of monetary policy is as follows. Assume that the Fed raises the federal funds rate in an environment in which the overall demand for credit is unchanged. In order to push the federal funds rate higher, the Fed has to reduce the supply of reserves (part of the monetary base) relative to the demand for reserves. So, all else the same, an increase in the federal funds rate entails a slowdown in the growth of the monetary base. Recall that the monetary base is – get ready – a component of thin-air credit. Ding! Ding! Ding! The federal funds rate is the base interest rate at which banks can obtain funds. As this base funding rate rises, banks will be induced to raise the interest rates at which they will loan funds. As bank loan interest rates rise, the quantity demanded of bank credit will decline. And what is the other and biggest component of thin-air credit? Bank credit. So, a Fed-induced rise in short-maturity interest rates relative to longer-maturity interest rates will lead to a slowdown in the growth of thin-air credit, which implies a slowdown in the growth of aggregate spending. Ah, the circle is completed. This is illustrated in Chart 2 in which is plotted the quarter-to-quarter annualized percent change in the sum of commercial bank credit and the monetary base vs. the quarterly average yield spread in percentage points between the Treasury 10-year security and the Treasury 1-year security. Notice that as the yield spread has been narrowing since 2014, growth in thin-air credit has been slowing.
But how can I be talking about a recession in 2019 when the economy seems to be bursting at its seams now? The Atlanta Fed’s Q2:2018 real GDP annualized growth forecast as of July 16 was a whopping 4.5%. If second-quarter real GDP growth were, in fact, to turn out to be 4.5%, this would represent the fastest quarter-to-quarter growth in real GDP the world has ever seen – that is, since the 5.2% growth in the third quarter of 2014 when you know who was president. Just as pride goeth before the fall, coincident indicators go up before a recession. In the past nine NBER business cycles, only three expansion peak quarters exhibited a contraction in real GDP. The largest peak-quarter real GDP growth was 4.7% (Q3:1981). The largest peak-quarter contraction was -1.7%. I suggest this country and western song title for economic forecasters – “How You Gonna See the Turn in the Road if You Keep Lookin’ Out the Side Window?”
With the real economy currently booming and the rate of consumer inflation trending higher, the Fed, in all likelihood, will not be able to constrain itself from raising the federal funds rate another 25 basis points at the end of its September 25-26 meeting. If the Fed holds its fire thereafter, the US economy just might be able to avoid a 2019 recession, although real economic growth will have slowed to a crawl. If the Fed goes ahead an raises the federal funds an additional 25 basis at its December 18-19 meeting, batten down the recession hatches in 2019.


