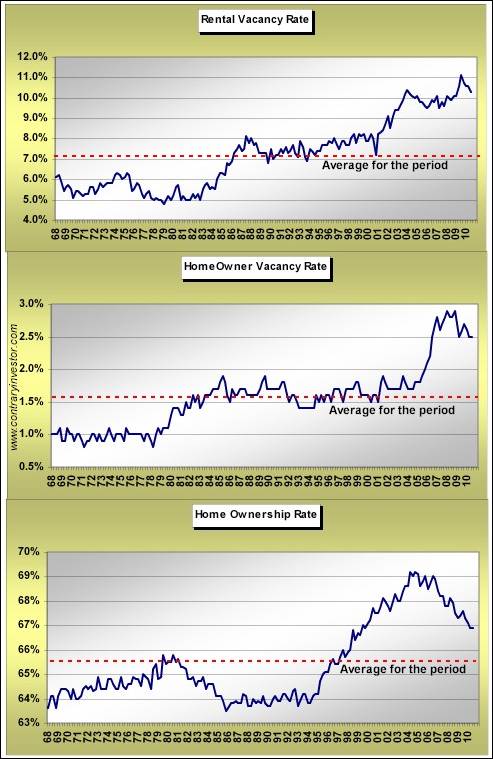
Trailers For Sale Or Rent, Rooms To Let...50 Cents...It has been a good long time since I’ve checked in on residential vacancy rates in the US, but it's time for that now. Important why? The dynamics of vacancy rates are suggesting that headline CPI may indeed be heading higher as we move into 2011, Fed QE or no QE. I'll roll through this quickly and show you what I’m referring to. First, a quick update of total US rental vacancy rates, the homeowner vacancy rate specifically, and the overall homeownership rate. If there is any positive news at all in the residential real estate world (single and multi-family), it's that vacancy rates have headed down in 2010 after hitting record highs last year. But of course as you can see in the top clip of the next chart, it's far from the dawn of a brand new day, so to speak. We have a long way to go simply to get back to longer term averages. That's a long way off at this point and will require a heck of a lot of supply absorption. Years away. Nonetheless, remember the positive here.
The middle clip of the chart is likewise "relative" good news, but again in absolute terms we're still quite the distance from what has been average experience of the last four plus decades. If any data point is closer than not to its long term average, it's the homeownership rate. That I do believe sees its longer term average experience prior to the other two data points that comprise the combo chart even coming near longer term averages. All part of longer term cycles and nothing particularly surprising at all.
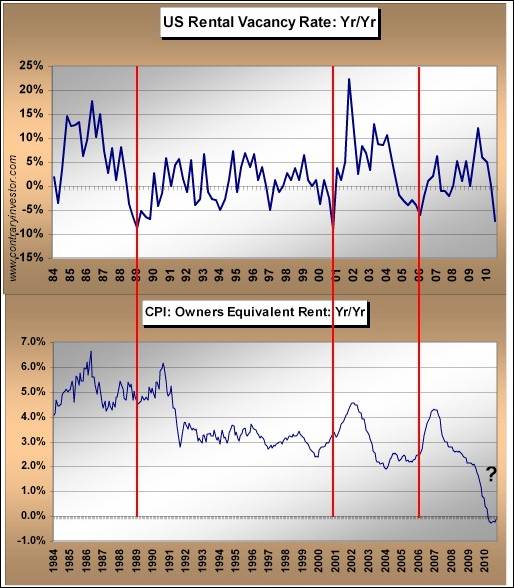
But it's the rental vacancy rate I want to focus upon for just a second as we think about where headline CPI is heading and how it may influence investor perceptions looking into next year. Important now, especially given the more than noticeable back up in interest rates as of late. I will not go into detail here as I’ve discussed this many a time in prior discussions, but we all know that owners equivalent rent and the cost of shelter together literally dominate the component weights of the reported CPI in the US. Together the number is near 35+% of the headline whole. And of course I have contended for many a moon that the headline CPI has been understating inflation given the literally historic softness in owner's equivalent rent due to the dynamics of the current housing cycle. When rental vacancy rates are as high as you see above, it's only a natural conclusion that rental rate softness is the order of the day. Isn't this exactly what the chart below is telling us? You bet it is. We've never seen anything like the bottom clip of the chart below.
As of now, we're just barely edging back toward zero on the annual rate of change meter. But as we look ahead and think about investor perceptions (this is the key) of CPI in 2011, it's the top clip of the above chart that's important. To the point, we know the rental vacancy rate remains high in absolute terms, but when looked at on a year over year basis, we've now hit a rate of change low seen only three other times over the last quarter century. At least so far we've never pierced this low. I've drawn in the red bars to not only document these lows, but make a point. As you can see, every time we've hit the current depth of rate of change lows in the vacancy rate, the subsequent year over year change in owner’s equivalent rate has been up. Every time. Will past be prologue? I believe it will. Especially if we can get even a modicum of job growth in the US looking ahead. Remember, I did not say gangbusters, but rather a modicum of growth. If indeed OER moves higher on a rate of change basis as I certainly expect given the rhythm of the rental vacancy data, it will kick headline CPI higher unless a multiplicity of issues outside of OER act to depress CPI.
What I've done below is look at what is defined as core CPI and subtracted out the OER/shelter portion of CPI. Now this trend indeed looks a bit different than the headline and core CPI numbers we see presented by the mainstream. If this were a stock chart, would you say the trend is up or down? You already know the answer.
I know you get the point so I'll leave it right there. The dynamics of the rental vacancy rate data are telling us it's a very good bet the rate of change in OER/cost of shelter rises into next year. Given their very meaningful combo weights in the headline CPI, this should produce a boost in headline CPI and inflation perceptions/expectations in general, assuming the consensus still keys in on headline CPI numbers. Add in the potential for intended and unintended inflationary consequences of QE, and investor perceptions may change meaningfully. Is this what the bond market is pricing in right now?
Why would a change in reported headline inflation perceptions be important? Because I do not believe investors have yet priced this into financial asset valuations. Although it’s only my personal view, I believe a lot of investors long ago discarded the CPI as a true measure of the cost of living. So, when it declines, it has been in large part ignored as a meaningful indicator. But what happens when the supposed indicator that understates actual inflation actually begins to rise? That’s the potential change in perceptions I’m thinking about. We've already seen a rise in interest rates post the QE2 announcement. No surprise as history told us to expect as much. IF investors price in higher inflationary expectations now inclusive of reported CPI moving into 2011, just what will that mean for macro equity valuations?
To be honest, initially it may not be the worst thing in the world. C’mon, equities in the current environment have ignored meaningfully rising bond yields up to this point. I’m going to save this for our early year 2011 themes and considerations discussions, but we need to think about the tsunami of money that has flooded US bond funds over the last few years. Will public investors, let alone institutional, remain faithful if those account values start to slip if indeed inflation perceptions and actually reported headline CPI numbers accelerate and bonds reflect as much? Again, it was a tsunami of money that came into bond funds. That was the tide flowing in. What about the potential for the tide flowing out within the context of a market whose inflation perceptions have been raised? Exactly why this is so important to consider.
From the institutional investment management playbook of life, investors have been taught that in historical economic recoveries, rising interest rates do not initially pose a threat to equity valuations (and of course upward price movement). Rising yields are seen as a validation point of improving macro economic fundamentals. But within the circumstances of the current cycle, as I’ve discussed many a time, incredibly important balance sheet reconciliation unfinished business remains. Deleveraging at the household level remains in its infancy. Leveraging up at the sovereign or government level remains a continual reality. Can a domestic economy still very highly systemically leveraged handle higher interest rates? Bernanke and FOMC friends may wish to instill “animal spirits” by lifting equities. But for households equities represent one-third of the value of residential real estate on household balance sheets. This leaves me with a bottom line that in the current apparent recovery cycle, rising interest rates may “bite” actual economic growth and equity valuations a lot sooner than has been the case in prior cycles of the last half century, despite rates still being quite low from a nominal perspective.
I know I sound like a maniac when suggesting this, but by the middle of next year could we be looking at a reported CPI number at 2% or above? And what investor perceptions and behavior would that engender? Just how many institutional investors are positioned for higher interest rates and higher reported headline CPI numbers going into the New Year?
All the best to you and your families for the holidays and New Year. I wish you health, happiness and prosperity in the year ahead.


