One of the greatest calls and investment advice I can remember from the beginning 2008 was the first of the year publication from Brian Pretti at ContraryInvestor.com, with the introduction to his piece provided below:
2008 Investment Themes And Considerations: Part I
The Management Team…We simply hate to kick off a new year on what might seem a bit of a somber note, but before taking even one step further into this new year, we want to quickly discuss the very important concept of investment risk management. We’ve referred to the importance of risk management so many times over the past six months that we’ve simply lost count. We know that for many of you this may be redundant or perhaps a bit simplistic, but we believe now is the time to remember and reinforce in our thinking the incredibly meaningful investment activity that is risk management. For as we look back over our own investment experience, it’s the selling (or hedging) that’s often the hardest of decisions, not the buying. And it’s little wonder as, plain and simple, the equity markets have an upward bias over time. Why so important now? In brief, it’s clear that the US economy is slowing rapidly. As we’ve said in the past, we’re not so sure we’re actually going to see it published, but a domestic recession is as high a probability today as at any time this decade. Let’s face it, the major underpinning of the credit markets that has been crucial both to the real US economy and financial markets over time is sending out SOS signals by the day. Point blank, we’re walking into 2008 at a very high-risk fundamental juncture from a macro perspective, one where the trajectory of a credit cycle of a generation is now in question, and an environment where the Fed and global central banking friends may not achieve yet another perfect reflationary outcome. Although we’ll have plenty to say about fundamentals, investment considerations and investment themes in our early 2008 discussions, we want to show you what we’re watching in terms of signs or signals that will simply force us to invoke capital risk management activities, regardless of our fundamental thoughts and beliefs. Let’s just hope we don’t have to pull the risk management trigger anytime soon. But if we do, establishing some type of game plan in advance reduces the role emotion plays in total portfolio management.
As Brian’s piece at the start of last year was quite insightful and timely, I’d like to present an update of some of his indicators as well as a few others to pound the table going into 2009 the important concept of risk management. The key with risk management is to accept that you won’t be getting in at the first inning nor getting out at the bottom of the ninth inning in terms of market trend changes, but that is an acceptable tradeoff for avoiding a great portion of the bloodbath that ensues with bear markets.
With that being said, the case has been made in several WrapUps in the course of the last six months that the U.S. markets are within the confines of a secular bear market that began in 2000 and will likely play out from the early to middle of the next decade. It is likely that we are in the fourth secular bear market going back to 1870.
Figure 1
Source: The Chart Store, Weekly Chart Blog (01/02/2009)
Within secular bear markets are cyclical bull and bear markets and we are likely near the end of the second cyclical bear market since 2000, with the 2000-2002 bear market being the first, and likely gettin a cyclical bull market that will begin in the second quarter to early summer of this year. Interestingly enough, we appear to be following a very similar price pattern to what the S&P 500 went through in the 1937-1938 bear market, with the prior experience pointing to a bottom in late March of this year if we follow a similar pattern going forward. Part of the reason why I think the markets have more pain ahead before they bottom is that there is still a lot of deleveraging to go through, and the NYSE margin debt to NYSE market cap ratio illustrates this point.
Figure 2
Source: The Chart Store, Weekly Chart Blog (01/02/2009)
Figure 3
Source: The Chart Store, Weekly Chart Blog (01/02/2009)
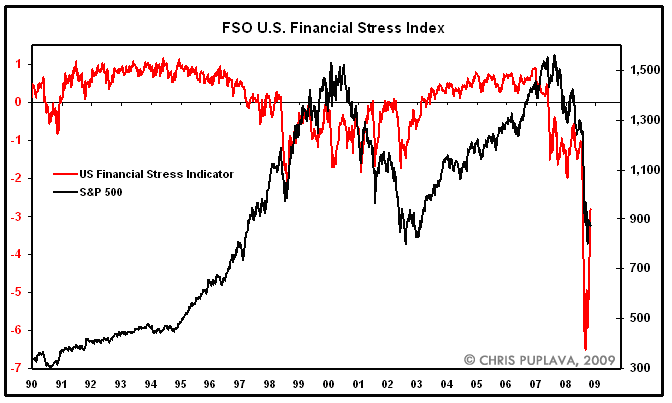
What we have experienced off the November lows is a market coming off significantly oversold conditions and still could be construed as a bear market bounce or bull trap. One indicator that I’ve presented over the last several months was created along the same concepts with the Bloomberg Financial Stress Index. My modified index puts the health of the money market, bond market, and equity market all in one, and provides great long term signals for exiting and entering the markets. As of yet the FSO Financial Stress Index (FSI) has retraced roughly half of its record decline in the October and November panics. As you can see, the indicator is still below any of the negative extremes seen in the 1997-2003 period indicating there is still a great deal of risk in the markets and the healthy all clear signal has yet to be sound.
Figure 4
Source: Bloomberg
In addition to the FSO FSI, one great long term market timing tool highlighted by Brian Pretti is the 15/40 exponential moving average (EMA) cross. It gave a buy signal in 1995 and kept you in the market up until 2000 when it went into a sell. It ignored all the bear market bounces and didn’t turn positive until 2003, only to turn negative four years later in 2007, quite the track record in just the past decade and one half. As seen below, the signal is still a ways off from crossing and the current rally remains to be a bear market rally until proven otherwise.
Figure 5
Source: Bloomberg
Historically, the 15/40 EMA signal has had a great track record and would have gotten investors out in 1929 and kept them out until just after the end of the Great Depression in 1932. It also proved quite useful for most of the rest of the decade, though the signaling system did not perform well in the sideways action from 1937-1941.
Figure 6
Source: Bloomberg
As stated above, if we are in fact in a secular bear market, the 15/40 EMA signal will prove to be a useful tool in getting in and out of the cyclical bear markets along the way, avoiding the many cyclical bear markets that may develop. This can be seen when looking at the how the signal performed in the 1968-1982 secular bear market.
Figure 7
Source: Bloomberg
Using a similar concept, the stock-bond ratio (S&P 500 versus the Merrill Lynch 10-Yr UST total return index) also provides a great risk management tool. A cross in the signal to the downside is a signal to move to bonds and exit stocks and a cross to the upside reverses the trade. The signal went negative in late 2000 and only turned positive in 2003, protecting investor capital in the prior bear market. The signal went negative in late 2007 and remains negative currently, helping investors avoid the devastating losses of 2008. As both the S&P 500 15/40 EMA and the stock-bond ratio 20/40 EMA signals remain negative, risk remains and we are still in a bear market.
Figure 8
Source: Bloomberg
While we are still in a bear market the stock-bond ratio is pointing to greater investment appeal coming from stocks than bonds. Looking at the ratio going back to 1982 and utilizing a proprietary bond allocation signal I developed, the model points towards a 20% allocation to bonds and 80% allocation to stocks as long-term treasuries present little value relative to stocks. The bond allocation weighting can also be used as a relative oversold and overbought rating on the S&P 500. A low allocation to bonds results after a sizeable correction in equities and we reached some of the most oversold conditions (low weighting towards bonds) in the S&P 500 seen over the last three decades, meaning that equities were due for a bounce, though it does not indicate an end to the current bear market.
Figure 9
Source: Bloomberg
The model is currently signaling a strong one-year return from the S&P 500 as shown below, which highlights what the equity allocation percent was over the last ten years and what the S&P 500 performance was one year later. No indicator is infallible, as seen when looking at the late 2000-2002 period that had a high exposure to equities with negative subsequent one-year returns. That being said, the indicator pointed to only a 20% weighting in equities in July of 2008 and a subsequent 80% holding in bonds which turned out to be a decent call. On March 14th of last year it had an 81% exposure to equities and only a 19% exposure to bonds, meaning it caught the decent rally over summer but quickly reversed those positions as the rally wore on. The indicator moved to an 83% equity weighting in late October of last year as the markets were greatly oversold, with the model currently calling for a 76% weighting to equities. While the model still points to a high weighting in equities, utilizing the timing signals above will help in the timing of putting sidelined cash to work with less risk.
Figure 10
Source: Bloomberg
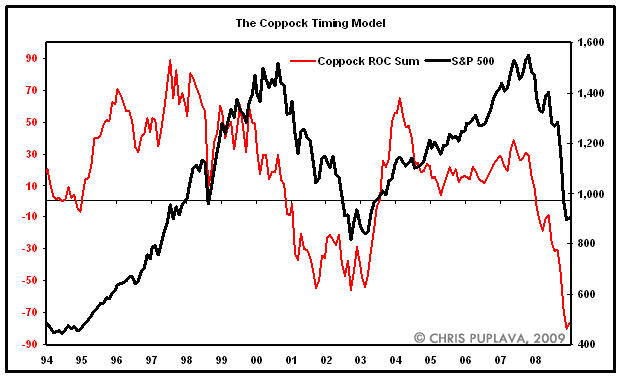
One last tool in the risk management tool chest I’d like to present is the Coppock Curve, an indicator Mr. Pretti presented in his first 2009 commentary. Looking purely at the rate of change (ROC) sum of the indicator shows that we reached the fourth most oversold condition in the last 80 years, meaning we can expect a decently sized cyclical bull market upon a reversal from these oversold conditions as we are currently more than two standard deviations below the long term average.
Figure 11
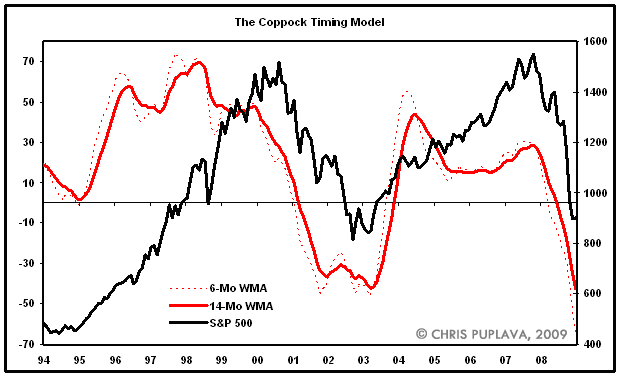
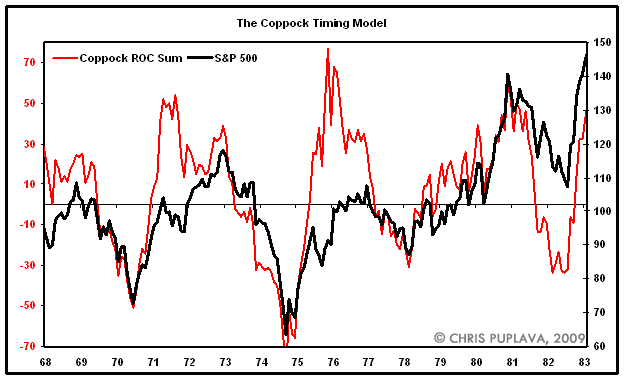
Utilizing the Coppock curve for timing purposes I back tested it and found that using a moving average cross signal helped avoid more false buys than the traditional model. The 6/14 month weighted moving average (WMA) signal did a great job during the last secular bear market in capturing the bulk of cyclical bull markets (Figure 12). Utilizing the moving average system for buy signals produces few false buys over the last century, with the 2001 signal being the greatest exception (Figure 13).
Figure 12
Figure 13
Using moves into negative territory as a sell signal with the non weighted signal helped in avoiding the bulk of the cyclical bears during 1968-1982 secular bear market, and has had a great record this decade getting investors out of the stock market in 2000 and late 2007.
Figure 14
Figure 15
So as we start the year we must be careful not to get caught up in what will likely prove to be a bear market rally, not being afraid to take profits once the current rally begins to fizzle. A higher return-to-risk entry point into the markets will likely present itself over the course of the next several months, and utilizing the risk management tools highlighted above will help investors to be on the right side of the trade with less risk.


