The stock market had a very strong week last week with the major indexes all up close to 2% or more. The Transports were the big winner for the week up 4.24%. In the commodities complex gold actually outperformed silver last week, which hasn’t occurred since March. Money is likely flowing into gold instead of silver since gold is much less overbought than silver. Industrials, Health Care, and Utilities were among the best performing sectors for the week.
The major indexes all broke out and made new highs for the year last week. The Nasdaq, Transports, and Russell 2000 are all starting to surpass their 2008 highs as well. The S&P 500 and Industrials are lagging the Nasdaq, Transports, and Russell 2000 in getting back to their former 2008 highs. It will be important to monitor whether the S&P 500 and Industrials are able to join the other three indexes in making new highs from 2008, otherwise the new highs in the other three indexes might not prove to be sustainable.
An interesting divergence has also setup between copper and the rest of the market. Copper is often called “Dr. Copper” since it is said to have a Ph.D. in economics. Copper tends to make major trend changes before the rest of the market so it is often noted when a move in the stock market is not being confirmed by the price of copper. Right now there is a divergence setting up between copper and the stock market where the market has moved higher over the last 2 months, but copper has actually moved lower. It’s possible this divergence could be forecasting another sell in May and go away summer for the stock market, so it will be important to see how this divergence plays out.
One reason the S&P 500 and Industrials are trailing the other major indexes is they have larger weightings in financials. Financials and homebuilders still have not recovered nearly as much damage as other sectors since the crisis in 2008. They were the two sectors that drove the financial crisis so it makes sense it is taking them a longer time to repair the damage done. The next chart shows the Financials and Homebuilders along with the Industrial, Retail, Consumer Discretionary, and Consumer Staples sectors. The latter four sectors are all making new highs above their 2008 highs while the Financials and Homebuilders have a long way to go.
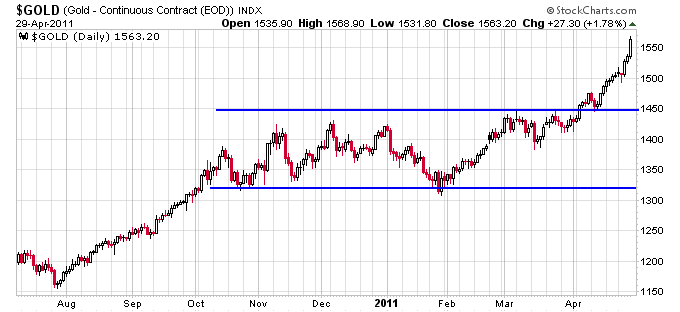
Gold gained almost last week and continues to trend higher. On the daily chart gold has now clearly broken free of the multi-month trading range it resided in since October 2010. In early April gold broke out of this trading range, then retested the trading range before moving higher for the rest of April.
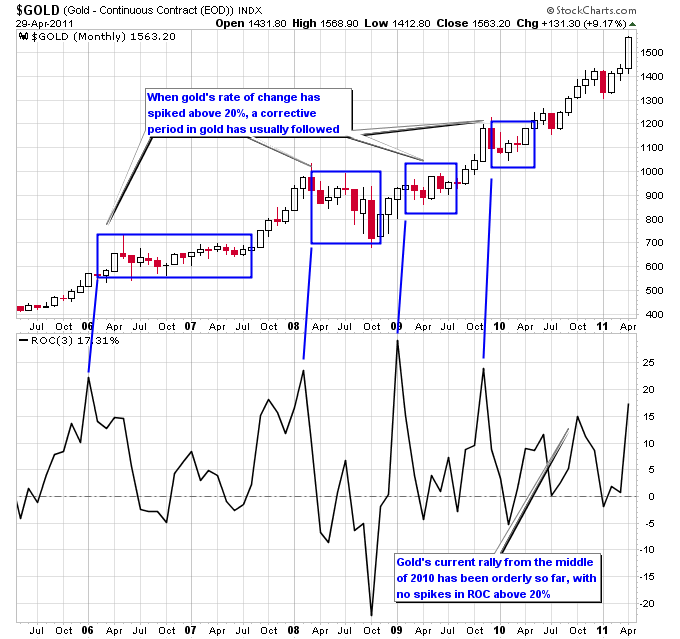
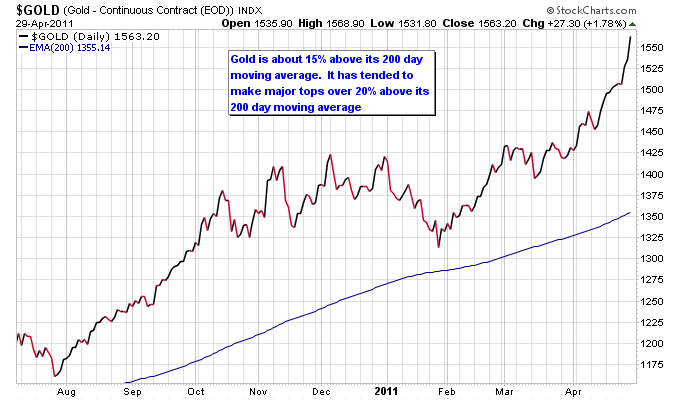
I discussed in recent articles here and here that gold had not reached similar overbought levels yet that it had reached in the past before it went through a major correction. With the rally this past week gold is getting further stretched but it is still not as overbought as it has been in the past before entering a major correction.
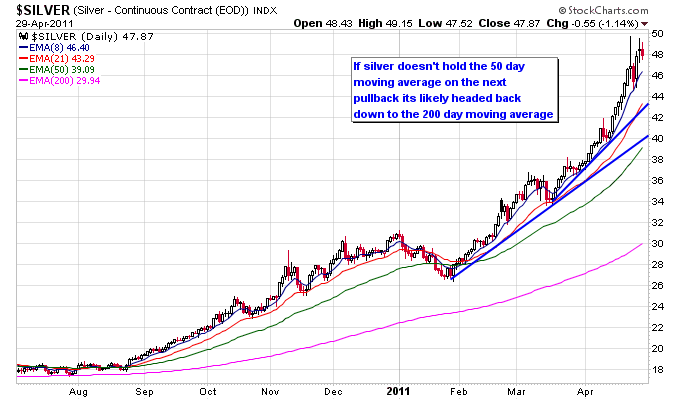
Silver had an extremely volatile week last week but managed to close higher on the week. As I’m writing this article silver is having a significant pullback in overnight trading which will likely lead into tomorrow. It looks like silver is going to undergo at least a correction off of its recent high, but it’s still left to be determined whether it then will go on to make new highs or not. A break below the 50 day moving average is probably a good line in the sand to determine when a correction in silver will turn into a crash back down to the 200 day moving average.
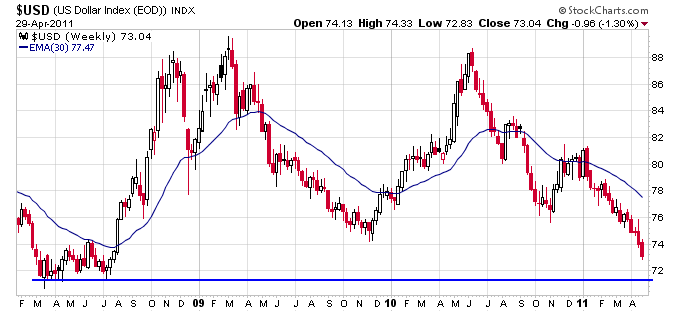
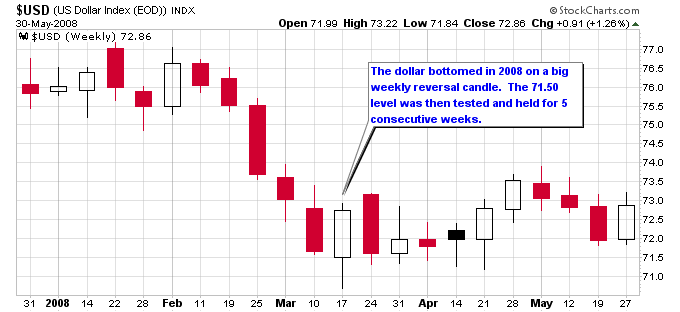
Whether the dollar holds support at 71.50 or breaks through that level will likely have a major effect on the gold and silver markets. A breakdown below that level would likely usher in another move up in gold and silver on their way to making a major top for this current move. A major reversal week in the dollar might be a good indicator for an end to the downtrend in the dollar. This is exactly what occurred in 2008 when the dollar made its bottom.
I expect gold and silver to make another major correction back down to their respective 200 day moving averages once they put in their final top. We should probably see this all occur within the next couple months which ties in well with the typical summer consolidation periods that happen often with gold and silver.


