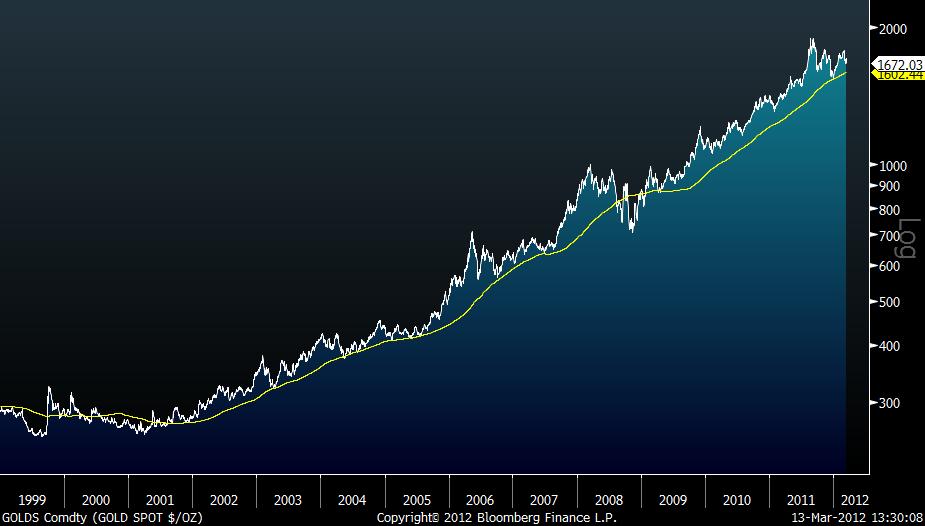
If gold were to definitively break its 300-day simple moving average currently resting at $1602.44, that could indicate a significant trend reversal only seen once in gold's 11-year bull market.
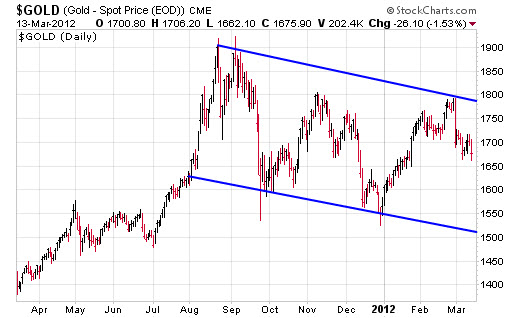
As you can see below, gold has been in a downward trend since last September after two failed attempts to push decisively above $1900.
Many have been wondering now with improving economic reports and reduced expectations for further monetary easing how far gold may correct. Of course, the answer to this question depends on a number of factors that are hard to predict considering that, for example, the exact timing of another round of quantitative easing by the Federal Reserve would almost certainly be a reaction to how future events unfold.
Thus, rather than take an intrepid stroke at predicting the future, one can play it much safer by simply following the trend. In the case of gold, many commentators have pointed out that there is perhaps no better long-term trend to follow than gold's 300-day simple moving average (300d SMA)—holding for the past 11 years of gold's bull run with the exception of only one major instance back in 2008 when things really got dicey.
As you can see above, this moving average has consistently defined support and currently lies at $1602.44. If gold were to break definitively below its 300d SMA, that could indicate a significant trend reversal only seen once in gold's 11-year bull market. On the other hand, for those looking for a good entry point, this would also serve as a reasonable downside target.


