


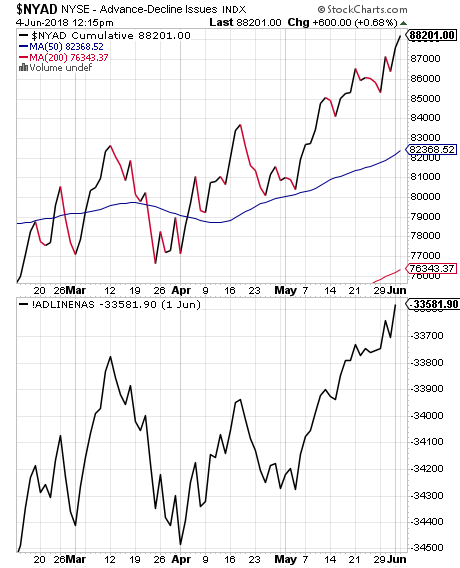
In case you’ve been under a rock for the last four months, we’re in the midst of an ongoing correction. Well … at least the major averages are. The market itself, as measured by breadth, has been setting new highs for the past three weeks or so.
You can see this in the charts below. The top chart shows the NYSE Advance-Decline line, and the bottom chart shows the Advance-Decline line for the Nasdaq.
But even though breadth is strong, the major averages remain below their January highs, which signals to most market participants that this correction is still ongoing. Therefore, let’s take a deeper dive into what exactly corrections are, and how they eventually resolve themselves.
The key point I’d like to get across today is that there are really two types of corrections: price corrections, and time corrections. Nearly all corrections are a combination of the two, but understanding these as separate entities will allow you to better assess when a correction is likely to end.
Before we go any further, we need to understand what exactly a correction is. According to Investopedia, a correction is a “reverse movement, usually negative, of at least 10% in a stock, bond, commodity or index to adjust for an overvaluation.”
First off – ignore that 10% figure. Corrections come in all shapes and sizes; we can have a 2% correction, a 5% correction or even (some might argue with this) a greater than 20% correction.
Read Correction Likely Not Over, Traders Rotating Into Energy Stocks, Says Craig Johnson
The reason some would argue with a decline of greater than 20% being called a correction is because this is often the dividing line where the financial media likes to invoke the term “bear market” instead.
Well, here’s what I think about that: In my world, a correction is an event that occurs during a period of improving economic conditions (aka. a bullish primary trend), when market prices rise too far above their long-term trendline and must revert back toward the mean. A bear market, on the other hand, represents an extended period when the primary trend of the market rolls over because economic fundamentals are deteriorating. Bear markets are nearly always accompanied by economic recessions.
The one part of Investopedia’s definition that I do agree with comes at the very end … corrections “adjust for an overvaluation.” Okay, but what does overvaluation mean? Isn’t that completely subjective? Well, yes and no.
This chart, (courtesy of painting-with-numbers.com) does a good job of illustrating overvaluation and undervaluation for us.

Over the last 100 years or so, the market has ebbed and flowed, but it has always moved higher. If we take price data over that time, we can extrapolate a regression line or line of best fit. In the chart above, this line is shown in red.
This regression line is our best estimate of the long-term growth rate of stocks. As you can see above, that figure comes out around 6.3%. I say “around” because this figure will shift slightly depending on the timeframe of the data used.
What this means is that if stocks had simply appreciated by 6.3% per year, each year, over the last 95 years, the market today would be at about the same level it is currently, and we would never have experienced a single correction or bear market.
But of course, that would never happen, because the human story is one of excess and scarcity … of greed and fear. When times are good, investors will bid stock prices up well past their long-term growth rate, but this condition is not sustainable … eventually, market prices must return to their regression line.
So the real question is: How does this process happen?
When most people envision a correction in the stock market, they think about falling prices. Even Investopedia’s definition above includes reference to a 10% price decline. But corrections do not always involve falling prices … we experience time corrections as well.
Let’s go back to my definition of a correction, above. Notice that in my world, we can have a correction that does not involve a drop in price… How is that possible?
The answer to this riddle goes back to that long-term trendline in our chart above (the red regression line). Notice that it is upward sloping – this is key.
You may also like Mindless Robots Have Taken Over the Markets, Says Don Coxe
For a variety of reasons (a topic for another day), our financial markets are biased to the upside. Over long periods of time, market prices always rise. As far as I’m concerned, this might as well be considered a law of the markets (remember that our so-called physical “laws” – such as gravity – are not laws because they’ve been proven … they remain laws simply because they haven’t been disproven). In the same way, a long-term upward trend in the market has never been disproven …
Therefore, when market prices rise too far above that long-term trendline (a period of overvaluation), the situation can be resolved two ways: market prices can decline back to the long-term trendline, or market prices can bide their time until the long-term trendline catches up to where market prices are.
In other words, since the long-term trend of the market has a positive slope, an overvalued market can work off the excess simply by going nowhere. Once the long-term trend catches up, the overvalued condition has effectively disappeared. Cool, right?
Some of this may seem obvious, but the reason I bring this up is because many investors believe that when the market is stuck in a trading range, nothing is happening. This is far from the case. Trading ranges represent corrections just as much as price drops do, it’s just that trading ranges are a form of time corrections.
This brings up another issue that I feel confuses a lot of investors – the notion of when a correction is over. Most investors will tell you that a correction ends when the market works its way back up to new highs. But this is the layman’s version…
If you understand what a correction really is, then it’s easy to see that a correction is not over when the market sets new highs … it’s over once prices regress to the long-term trend. At that point, the conditions that necessitated the correction have been resolved.
Okay, now let’s apply this notion of price and time corrections to the current market. In the chart below you can see that the S&P remains in a short-term upward trend, but that market prices still haven’t recovered to the late-January peak.

You might be tempted to think this means nothing has really changed over the last four months, but this is not so. For example, think about what’s happened with earnings, the so-called “mother’s milk” of stocks.
While prices have been going nowhere, earnings have been improving at a steady rate. According to FactSet, the blended earnings growth rate for the 1st quarter (with 98% of S&P 500 companies having reported), currently stands at 18.9%. Not only that, analysts are projecting earnings growth of 19.6% for all of 2018.
So while prices are going nowhere, earnings are rising. This means that horizontal price action is actually resulting in a decline in overall valuation levels (the denominator in the P/E ratio is rising while the P remains constant). So even if prices stay at their current levels for a while, fundamentals are improving beneath the surface, which means valuation levels are declining.
There’s one last comment I’d like to make about time corrections, and it has to do with human psychology. As creatures, we have incredibly bad short-term memories, and we tend to adapt rather well to changing conditions. This means that even if the fundamental cause of a correction has not resolved itself (such as the prospect of a trade war, or rising interest rates), over time we adapt to these conditions and see them as less of a threat.
And it doesn’t take long for this to happen.
Listen to The Bond Market: On the Precipice
Dan Gilbert is a Harvard psychologist who has studied the mind for decades. He’s the author of Stumbling on Happiness, a New York Times bestseller. Much of Gilbert’s work focuses on the Impact Bias – our “tendency to overestimate the hedonic impact of future events.”
According to Dr. Gilbert, both positive and negative events that we experience “have far less impact, less intensity, and much less duration than people expect them to have.” This even applies to terrible events, with Gilbert noting that “a recent study showing how major life traumas affect people suggests that if it happened over three months ago, with only a few exceptions, it has no impact whatsoever on your happiness.”
If you substitute “major market events” for “major life traumas” and “investor sentiment” for “happiness,” you can see why after a few short months, we simply don’t care as much about negative market incidents. We’ve adjusted to them; they’re old news, they don’t hold us emotionally captive any longer, and therefore don’t impact our (the market’s) trading as much.
So during a primary bull market, time corrections really serve two purposes: They allow fundamentals to play catch-up with prices, and they allow investor psychology to chill out. Once both these factors are in place, we find that the correction has more often than not run its course, and a resumption of the primary trend can commence.
The preceding content was an excerpt from Dow Theory Letters. To receive their daily updates and research, click here to subscribe. Matt is also the Chief Investment Strategist at Model Investing. For more information about algorithmic based portfolio management, click here.


